On this page
- The short answer
- Dashboards, reporting, business intelligence, and analytics each serve different purposes.
- The requirements that matter
- The best software by use case
- How Brandwave differs
- Run a 30-minute requirements workshop.
- Prove the shortlist with one closed campaign.
- Build the stack in the right order.
- FAQ
The short answer
Evidence-backed marketing investment decisions
- Choice
- Brandwave
- Public starting price
- Free; paid from US$139/month
Accessible KPI dashboards for an in-house team
- Choice
- Databox
- Public starting price
- Free; Analyst $64/month annually
Agency client portals and automated reports
- Choice
- AgencyAnalytics
- Public starting price
- $20/client/month annually
High-volume white-label client reporting
- Choice
- Whatagraph
- Public starting price
- €699/month annually
Free, flexible do-it-yourself reporting
- Choice
- Google Data Studio
- Public starting price
- No charge; Pro $9/user/project/month
Custom BI in a Microsoft-centered organization
- Choice
- Microsoft Power BI
- Public starting price
- Desktop free; Pro from $14/user/month
Governed marketing data, harmonisation, and many destinations
- Choice
- Funnel
- Public starting price
- $300/month annually
| Best for | Choice | Public starting price |
|---|---|---|
| Evidence-backed marketing investment decisions | Brandwave | Free; paid from US$139/month |
| Accessible KPI dashboards for an in-house team | Databox | Free; Analyst $64/month annually |
| Agency client portals and automated reports | AgencyAnalytics | $20/client/month annually |
| High-volume white-label client reporting | Whatagraph | €699/month annually |
| Free, flexible do-it-yourself reporting | Google Data Studio | No charge; Pro $9/user/project/month |
| Custom BI in a Microsoft-centered organization | Microsoft Power BI | Desktop free; Pro from $14/user/month |
| Governed marketing data, harmonisation, and many destinations | Funnel | $300/month annually |
We built this shortlist by checking product features, limitations, and public prices on 26 August 2026 using the vendors’ own websites. Each product was chosen to match a specific reporting need, from client delivery and DIY dashboards to governed data and marketing intelligence. The order is based on how well each tool fits those needs, not on affiliate payments, feature count, or claims that one tool is best for everyone.
Dashboards, reporting, business intelligence, and analytics each serve different purposes.
Connector
- Owns
- Authenticated pulls, scheduled transfers, source schemas, and destinations
- Usually does not own
- The business meaning of the final decision
Data hub or warehouse
- Owns
- History, harmonisation, transformations, permissions, and reusable datasets
- Usually does not own
- A ready-to-use executive narrative without modeling and presentation work
Dashboard or client reporting
- Owns
- Metrics, visualizations, templates, recipients, schedules, and presentation
- Usually does not own
- Causal proof that a channel created an outcome
Attribution or modeling
- Owns
- A defined method for associating outcomes or estimating contribution
- Usually does not own
- Every offline, brand, or customer-reported signal
Marketing intelligence record
- Owns
- Activity, spend, outcomes, evidence, context, and the decisions made from them
- Usually does not own
- Every connector, experiment, survey panel, or econometric model
| Layer | Owns | Usually does not own |
|---|---|---|
| Connector | Authenticated pulls, scheduled transfers, source schemas, and destinations | The business meaning of the final decision |
| Data hub or warehouse | History, harmonisation, transformations, permissions, and reusable datasets | A ready-to-use executive narrative without modeling and presentation work |
| Dashboard or client reporting | Metrics, visualizations, templates, recipients, schedules, and presentation | Causal proof that a channel created an outcome |
| Attribution or modeling | A defined method for associating outcomes or estimating contribution | Every offline, brand, or customer-reported signal |
| Marketing intelligence record | Activity, spend, outcomes, evidence, context, and the decisions made from them | Every connector, experiment, survey panel, or econometric model |
Today’s products often combine several features. For example, Databox prepares datasets and offers an API and MCP server. Funnel includes dashboards, AI, and measurement add-ons. Supermetrics now provides dashboards, storage, data transformations, API, and MCP access in its packages. Brandwave offers dashboards, an API, and an MCP server. Because of this overlap, it’s more important to know what each product actually tracks and what tasks your team will still need to handle.
A dashboard shows a model, even if it’s not clearly defined. For example, revenue by channel depends on rules for attribution, time frames, identity, currency, and how sources are defined. If only one analyst knows these details, good-looking charts can actually hide important uncertainties.
Marketing measurement software should make those definitions, attribution choices, and limitations visible rather than presenting every calculated result as certainty.
The influencer marketing measurement framework shows how to keep activity, costs, platform metrics, outcomes, attribution methods, and limitations connected without treating correlation as proof.
The requirements that matter
- Decision and audience: write the exact weekly, campaign-closeout, or investment question and who needs to act on it.
- Source ownership: list owned accounts, third-party creators or partners, offline activity, finance, CRM, analytics, surveys, and brand-demand sources.
- Metric definitions: state which numbers can be compared, how cost is allocated, and which attribution method sits behind each outcome.
- History and refresh: decide whether the job needs intraday operations, weekly optimization, monthly reporting, or multi-year investment evidence.
- Transformation and governance: check currency, time zone, naming, joins, calculated metrics, approvals, version history, permissions, and auditability.
- Distribution: decide whether users need a client portal, PDF, slide deck, shared URL, embedded dashboard, API, spreadsheet export, or AI-assistant access.
- Implementation burden: include data engineering, connector maintenance, dashboard design, analyst review, onboarding, and customer-success services.
- Exit and ownership: test export, API access, warehouse control, retention, contract terms, and what survives if the subscription ends.
The best software by use case
Brandwave
- Best for
- Best for: A queryable marketing record for investment decisions
- Starting price:
- Free; paid from US$139/month
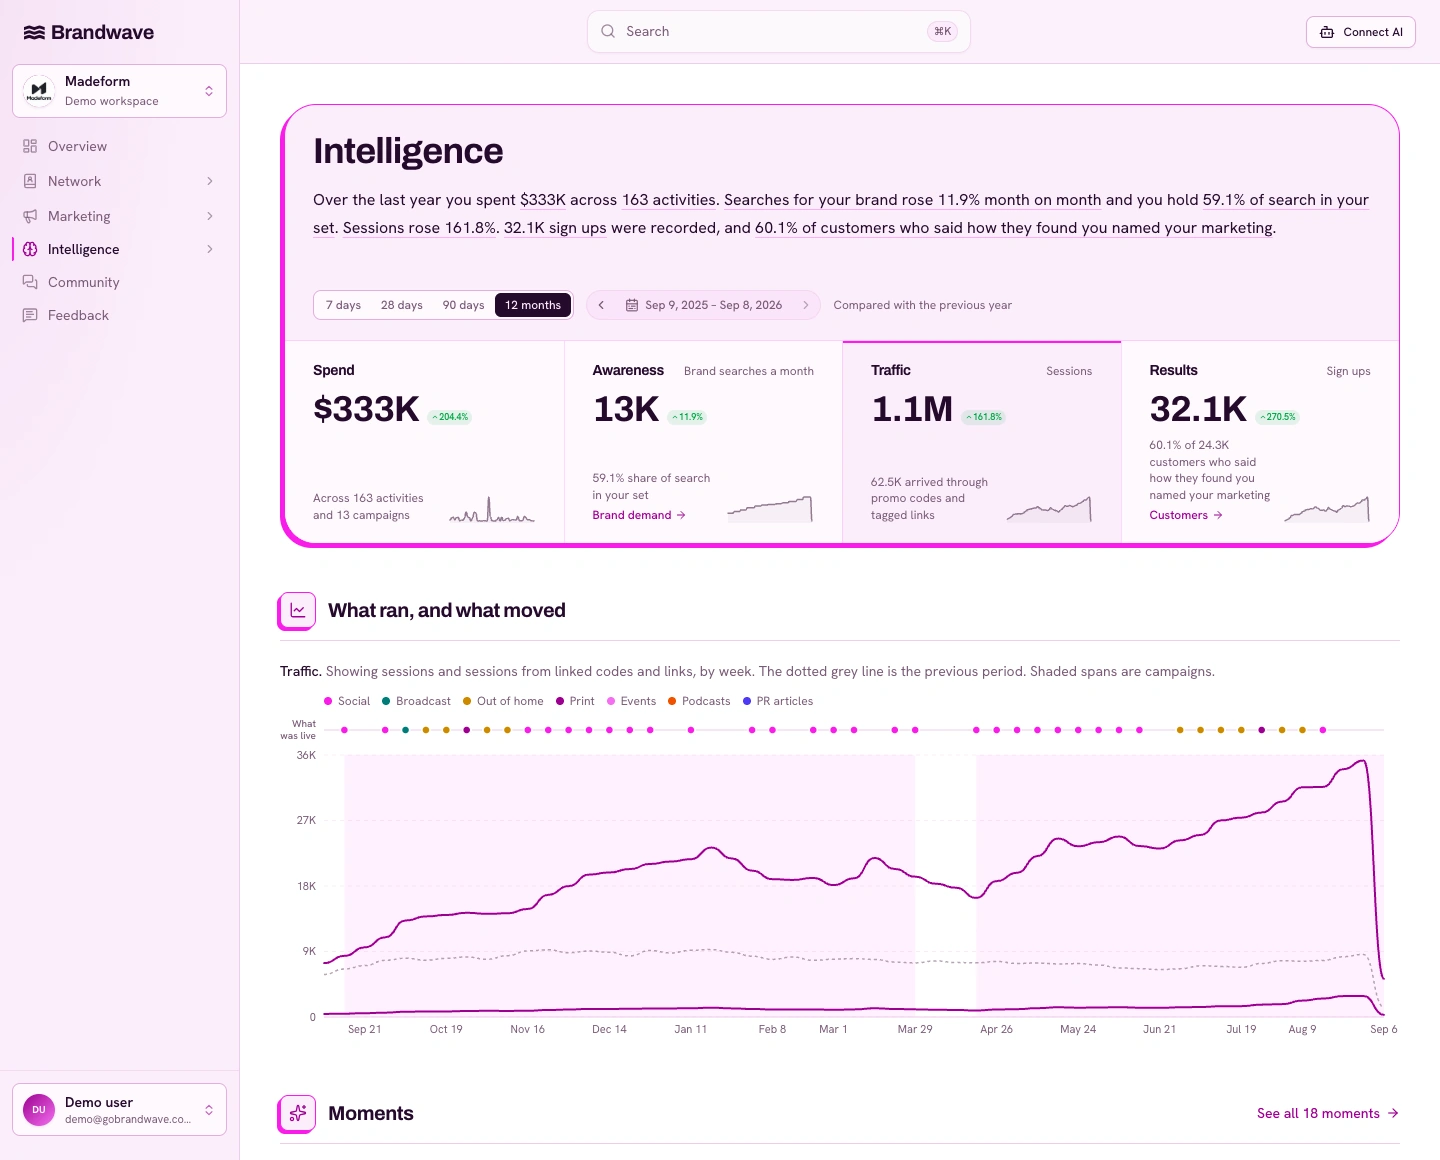
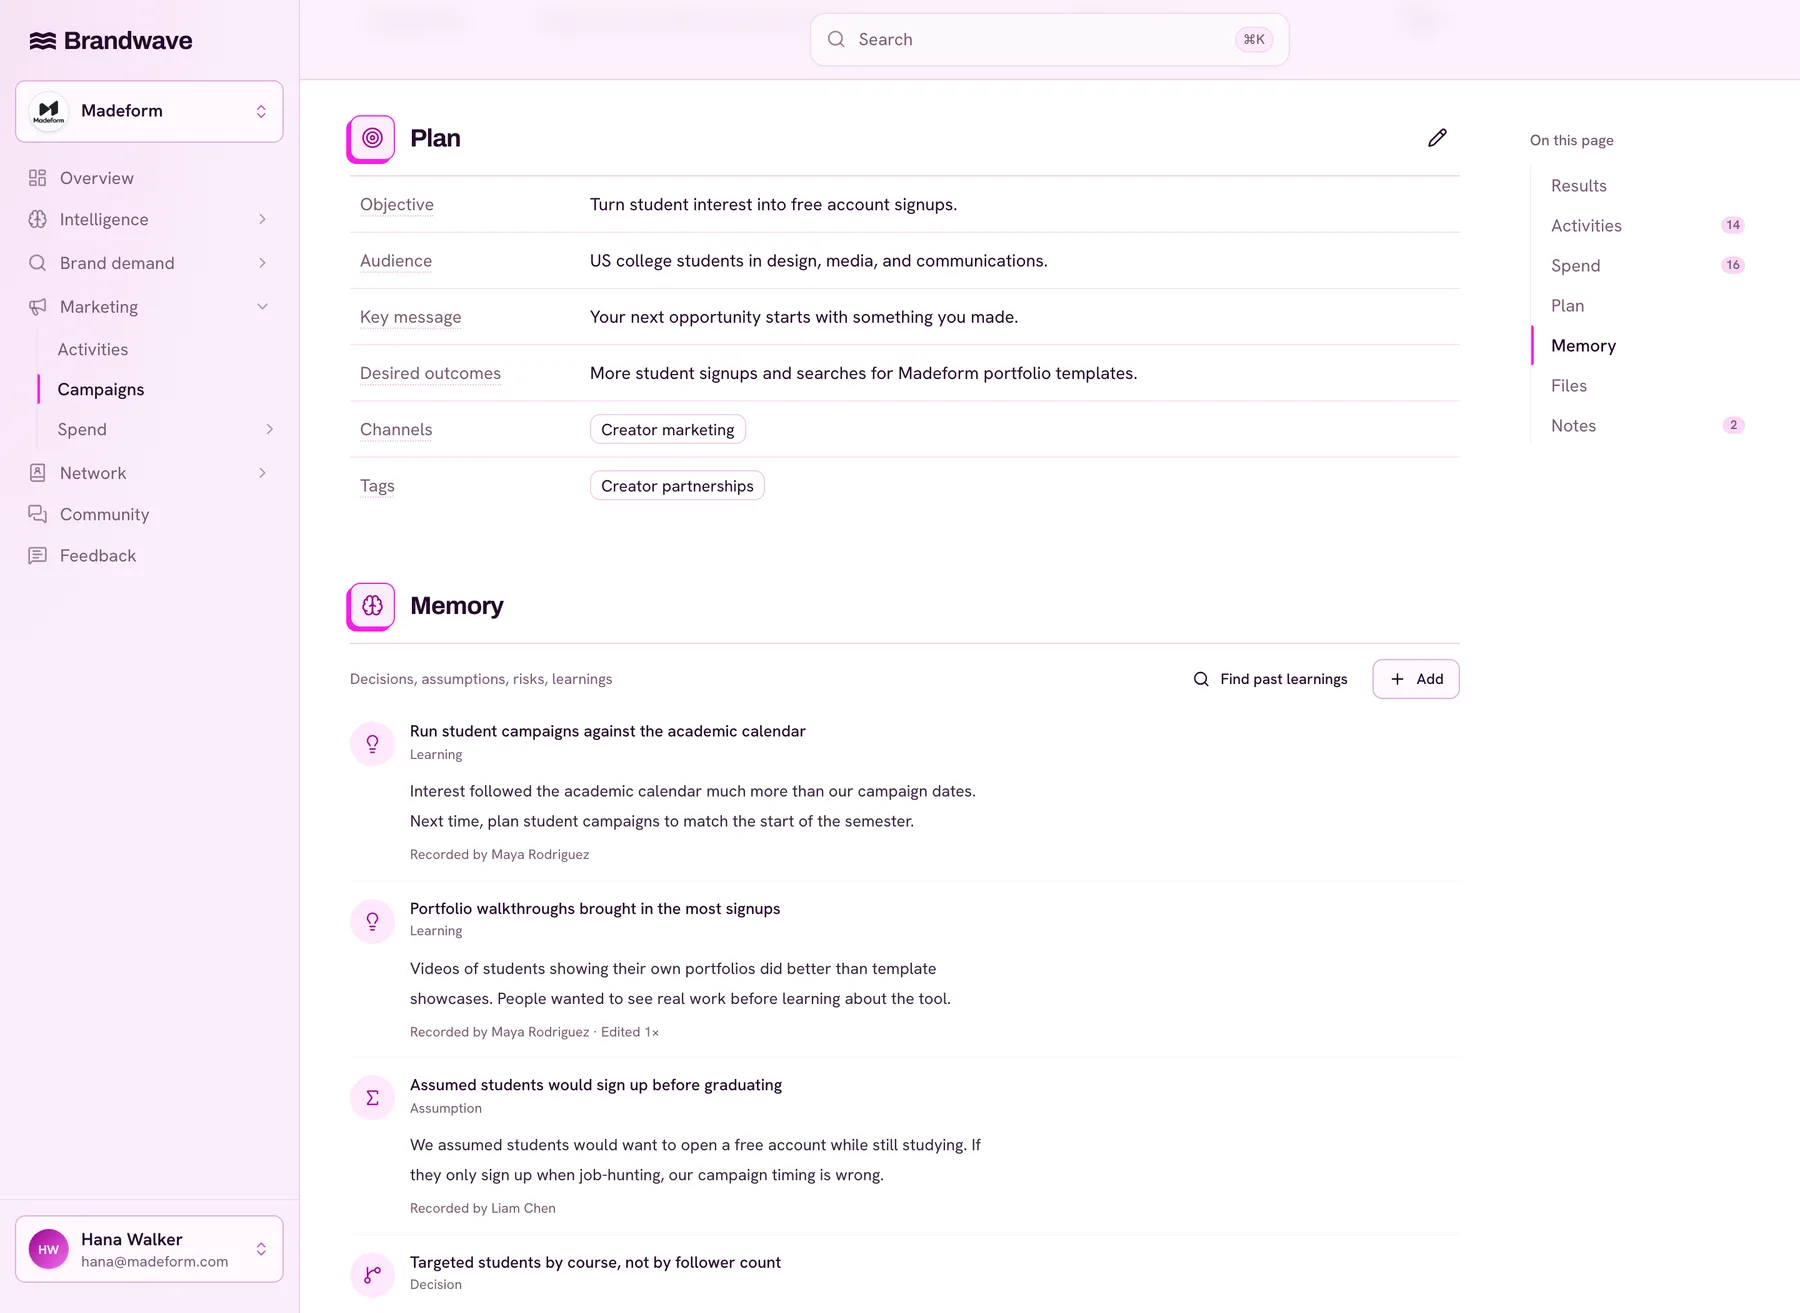
Brandwave brings marketing activity, spend, outcomes, and brand signals from many channels into one evidence-backed record. Its creator-marketing features automatically track content and performance across Instagram, YouTube, TikTok, X, LinkedIn, and Reddit. At the same time, teams can record campaigns and work across broadcast, out-of-home, print, PR, events, podcasts, and other channels on the same timeline.
The reporting features cover campaigns, activities, creators, cost efficiency, outcomes, direct signals, customer-reported attribution, and brand demand. You can access the same approved records through the HTTP API and MCP server. Pick this tool if your main challenge is linking your work to evidence for the next budget decision. It’s not the best fit if you need white-label client portals, lots of paid-media connectors, custom BI visuals, creator discovery, CRM, MMM, or incrementality testing.
Databox
- Best for
- Best for: Accessible KPI dashboards and performance management
- Starting price:
- Free; $64/month annually
Databox offers more than 130 integrations, plus spreadsheets, databases, custom integrations, datasets, dashboards, reports, goals, alerts, anomaly detection, an API, MCP access, and its Genie analyst. The free plan includes three sources, one user, one dashboard or report, and daily refresh. Analyst is $64 per month billed annually for five sources, one user, unlimited dashboards and metrics, and hourly refresh.
The Pro plan costs $159 per month, billed annually, and includes unlimited users. You can add more data sources for $5.60 each per month. The Growth plan is $399 and adds richer datasets, 15-minute refresh for selected data, forecasting, sub-accounts, and a dedicated customer success manager. Databox is a good choice if you care more about seeing KPIs quickly and sharing them than about keeping a detailed record of all marketing activities.
AgencyAnalytics
- Best for
- Best for: Agency client reporting and portals
- Starting price:
- $20/client/month annually
AgencyAnalytics offers one $20-per-client-per-month annual plan with unlimited reports, dashboards, data sources, staff users, and client users. It includes white-label branding, a client portal, scheduled reporting, goals, alerts, anomaly detection, benchmarks, forecasting, API access, MCP access, and 85+ integrations. Enterprise is custom for 25 or more clients.
Choose this tool if your agency is organized around clients and uses accounts that clients own and connect. It’s not as useful for tracking third-party creator content or program costs outside those accounts. That’s why some agencies use Brandwave as well for measuring creator campaigns. You can also check the full AgencyAnalytics alternatives comparison.
Whatagraph
- Best for
- Best for: Premium white-label reporting at scale
- Starting price:
- €699/month annually
Whatagraph’s Max plan starts at €699/month billed annually. It includes advanced integrations, data groups and blends, white-label reports, KPI overviews with alerts, and a dedicated success manager. Prime is custom and adds premium integrations, a custom report domain, public API access, transfers to BigQuery and Looker, and priority support.
Pick this tool if your main challenge is producing, managing, branding, and delivering lots of reports for clients or stakeholders. The cost is hard to justify for a single small in-house dashboard, but it makes sense if it replaces a lot of agency report work.
Google Data Studio
- Best for
- Best for: Free, flexible dashboard building
- Starting price:
- No charge; Pro $9/user/project/month
Google’s current page calls the product Data Studio and lists direct access to more than 1,400 sources plus more than 1,300 community connectors. The drag-and-drop editor supports interactive multi-page reports, sharing, collaboration, and embedding. The self-service product is free for creators and viewers. Pro is $9 per user per project per month for team content management, Cloud support, administration, and enterprise security controls.
Choose this tool if your data sources are already supported or if your team can handle building connectors, data models, calculations, quality checks, and maintaining reports. The subscription might be free, but the reporting process can still take a lot of work.
Microsoft Power BI
- Best for
- Best for: Custom BI in Microsoft-centered organizations
- Starting price:
- Desktop free; Pro $14/user/month
Power BI Desktop provides a free Windows authoring environment. Power BI Pro is publicly listed from $14 per user per month, and Premium Per User from $24, subject to market, contract, and Microsoft 365 or Fabric licensing. It supports semantic models, Power Query transformation, DAX calculations, governed workspaces, sharing, embedding, and the wider Microsoft data platform.
Pick Power BI if your organization has analysts or data owners who can build and manage a reusable BI model and already uses Microsoft tools. It’s more flexible than a marketing-only dashboard but requires more effort from your team. Make sure to calculate licensing and capacity at the tenant level, not just by multiplying the seat price.
Funnel
- Best for
- Best for: Governed marketing data and downstream reporting
- Starting price:
- $300/month annually
Funnel Starter begins at $300 per month billed annually with 117 connectors, 13 destinations, storage, semantic business logic, budgets and targets, dashboards, AI, and MCP access. Business starts at $600, expands to 579 connectors and 46 destinations, and adds advanced Data Hub capabilities plus reporting and cloud destinations. Enterprise is custom.
Choose Funnel if your main need is reliable marketing data, consistent definitions, storage, governance, and the ability to reuse data across different reports. Funnel Measure adds MMM, MTA, and incrementality for Business and Enterprise plans. Funnel can provide dashboards, but its biggest strength is the solid, governed data foundation it offers.
How Brandwave differs
Primary object
- Brandwave
- Marketing activity, spend, outcomes, evidence, and decision context
- general dashboard software
- Metrics, datasets, dashboards, reports, and recipients
Creator activity
- Brandwave
- Third-party creator content and performance across six social platforms
- general dashboard software
- Usually owned or connected brand/client accounts
Offline and non-API work
- Brandwave
- Recorded on the same campaign timeline
- general dashboard software
- Usually imported, modeled elsewhere, or entered in a custom source
Outcome evidence
- Brandwave
- Success metrics, direct signals, customer-reported attribution, and brand demand kept distinct
- general dashboard software
- Whatever metrics and attribution fields the configured sources provide
Access
- Brandwave
- Web app, HTTP API, and MCP server
- general dashboard software
- Varies: dashboards, exports, portal, API, warehouse, or MCP
Not designed for
- Brandwave
- White-label portals, general BI, broad ETL, MMM, or incrementality experiments
- general dashboard software
- A purpose-built marketing activity and evidence record
| Feature | Brandwave | general dashboard software |
|---|---|---|
| Primary object | Marketing activity, spend, outcomes, evidence, and decision context | Metrics, datasets, dashboards, reports, and recipients |
| Creator activity | Third-party creator content and performance across six social platforms | Usually owned or connected brand/client accounts |
| Offline and non-API work | Recorded on the same campaign timeline | Usually imported, modeled elsewhere, or entered in a custom source |
| Outcome evidence | Success metrics, direct signals, customer-reported attribution, and brand demand kept distinct | Whatever metrics and attribution fields the configured sources provide |
| Access | Web app, HTTP API, and MCP server | Varies: dashboards, exports, portal, API, warehouse, or MCP |
| Not designed for | White-label portals, general BI, broad ETL, MMM, or incrementality experiments | A purpose-built marketing activity and evidence record |
Brandwave created this comparison and is also one of the products listed. This potential conflict should be clear. Brandwave is recommended only if your main need matches what it does best: connecting marketing work, costs, outcomes, direct evidence, and brand signals so your team can explain decisions. The other tools in this guide are better for their specific purposes.
Pick AgencyAnalytics or Whatagraph if your main job is delivering reports to clients. Choose Data Studio or Power BI if you want to build your own visual and data models. Go with Funnel if you need strong data collection and distribution. Choose Databox if quick KPI tracking and performance management matter most.
Run a 30-minute requirements workshop.
- Write one decision question in plain language: for example, Which campaign deserves another $50,000 next quarter, and what evidence supports that call?
- Name the decision owner, report builder, data owners, viewers, and anyone who must approve definitions.
- List must-have sources as exact accounts and records, including activity without an API, finance, direct responses, and brand signals.
- Define the primary outcome, attribution method, time window, currency, time zone, and the important caveat leadership must see.
- Choose the required cadence from the action. Distinguish data refresh from report review and from the decision itself.
- Specify how the answer must be consumed: web app, client portal, PDF, slides, embedded dashboard, API, warehouse, or AI assistant.
- Set a total-cost ceiling that includes internal build and maintenance time, onboarding, connectors, services, and exit work.
Marketing reporting software POC scorecard (XLSX)
Weight your requirements, score the same closed campaign in each shortlisted tool, reconcile the evidence, and keep the final decision auditable.
Prove the shortlist with one closed campaign.
Use the same closed campaign, source extracts, finance totals, definitions, and questions for every vendor. A live campaign makes reconciliation harder because both the source numbers and the software configuration keep changing. The goal is not a beautiful demo. It is to learn how reliably each product turns your evidence into an answer your team can explain.
Start by reconciling activity count and actual spend. Then reconcile one volume metric and one business outcome back to their source systems. Record every unexplained difference. Ask the same follow-up question in each tool and measure the human work required to answer it. Finally, export the data and report, test viewer permissions, and document what must be maintained each month.
Reconciliation
- Evidence to retain
- Source total, product total, difference, reason, and owner
- Failure signal
- A polished dashboard nobody can tie back to finance or the platform
Definition change
- Evidence to retain
- Old and new formula, affected reports, approval, and version
- Failure signal
- The edit silently changes historical reporting
Follow-up question
- Evidence to retain
- Steps, time, data access, and any analyst intervention
- Failure signal
- Every new question requires a new export and dashboard build
Distribution and access
- Evidence to retain
- Recipient, permission, format, and external-sharing behavior
- Failure signal
- Sensitive data leaks or the intended audience cannot inspect the answer
Exit test
- Evidence to retain
- Exported data, definitions, report, API result, and deletion/retention terms
- Failure signal
- The marketing history cannot be recovered in a usable form
| POC test | Evidence to retain | Failure signal |
|---|---|---|
| Reconciliation | Source total, product total, difference, reason, and owner | A polished dashboard nobody can tie back to finance or the platform |
| Definition change | Old and new formula, affected reports, approval, and version | The edit silently changes historical reporting |
| Follow-up question | Steps, time, data access, and any analyst intervention | Every new question requires a new export and dashboard build |
| Distribution and access | Recipient, permission, format, and external-sharing behavior | Sensitive data leaks or the intended audience cannot inspect the answer |
| Exit test | Exported data, definitions, report, API result, and deletion/retention terms | The marketing history cannot be recovered in a usable form |
Build the stack in the right order.
Small teams should begin by focusing on the decision, stable IDs, clear definitions, finance reconciliation, and keeping a campaign record. The free campaign tracker gives you this basic structure. Only add more software when it actually solves a real problem, not just because a maturity chart says you need a data warehouse.
As your team grows, you might use a connector or data hub, a warehouse or semantic layer, and a specialized marketing record or reporting tool. Make sure to decide which layer is responsible for each metric so you don’t end up with multiple versions of revenue, spend, or campaign data. Even with a mature setup, experiments and models still need clear assumptions, an understanding of uncertainty, and decision context.
If Supermetrics is already part of the stack, the Supermetrics alternatives guide explains when to replace it and when to keep it beside a reporting or intelligence layer. For creator-specific board reporting, the influencer marketing dashboard guide shows the views and metrics in practice.
FAQ
Sources
- Brandwave pricing and plan comparison (gobrandwave.com)
- Databox pricing, integrations, dashboards, API, and MCP (checked 26 August 2026) (databox.com)
- AgencyAnalytics pricing and plan capabilities (checked 26 August 2026) (agencyanalytics.com)
- Whatagraph pricing and plan capabilities (checked 26 August 2026) (whatagraph.com)
- Google Data Studio product and pricing page (checked 26 August 2026) (cloud.google.com)
- Microsoft Power BI pricing (microsoft.com)
- Funnel pricing, Data Hub, dashboards, and Measure add-on (checked 26 August 2026) (funnel.io)
- Supermetrics pricing and current package capabilities (checked 26 August 2026) (supermetrics.com)
Get the next article by email
Drop us your email and we'll let you know when we publish a new article.
By continuing you'll get an email for each new article and occasional product news from Brandwave. Unsubscribe any time. Privacy