On this page
- What I would show a CEO or CFO in five minutes
- Explain why these creators and channels matter
- An influencer marketing ROI dashboard needs more than cheap conversions
- The influencer marketing metrics I use, and what I pair them with
- Show HDYHAU alongside last-touch attribution
- Cohort analysis: what the Black Friday Olympics taught me
- Why I kept a partnership with weaker engagement
- What I say when there are no tracked conversions
- Use the dashboard to stop, continue or change investment
- Free influencer marketing reporting template
- FAQ
What I would show a CEO or CFO in five minutes
Influencer marketing reporting template (XLSX)
Activities log, campaign rollup with CPE and CPM formulas, and a leadership summary sheet. No email required.
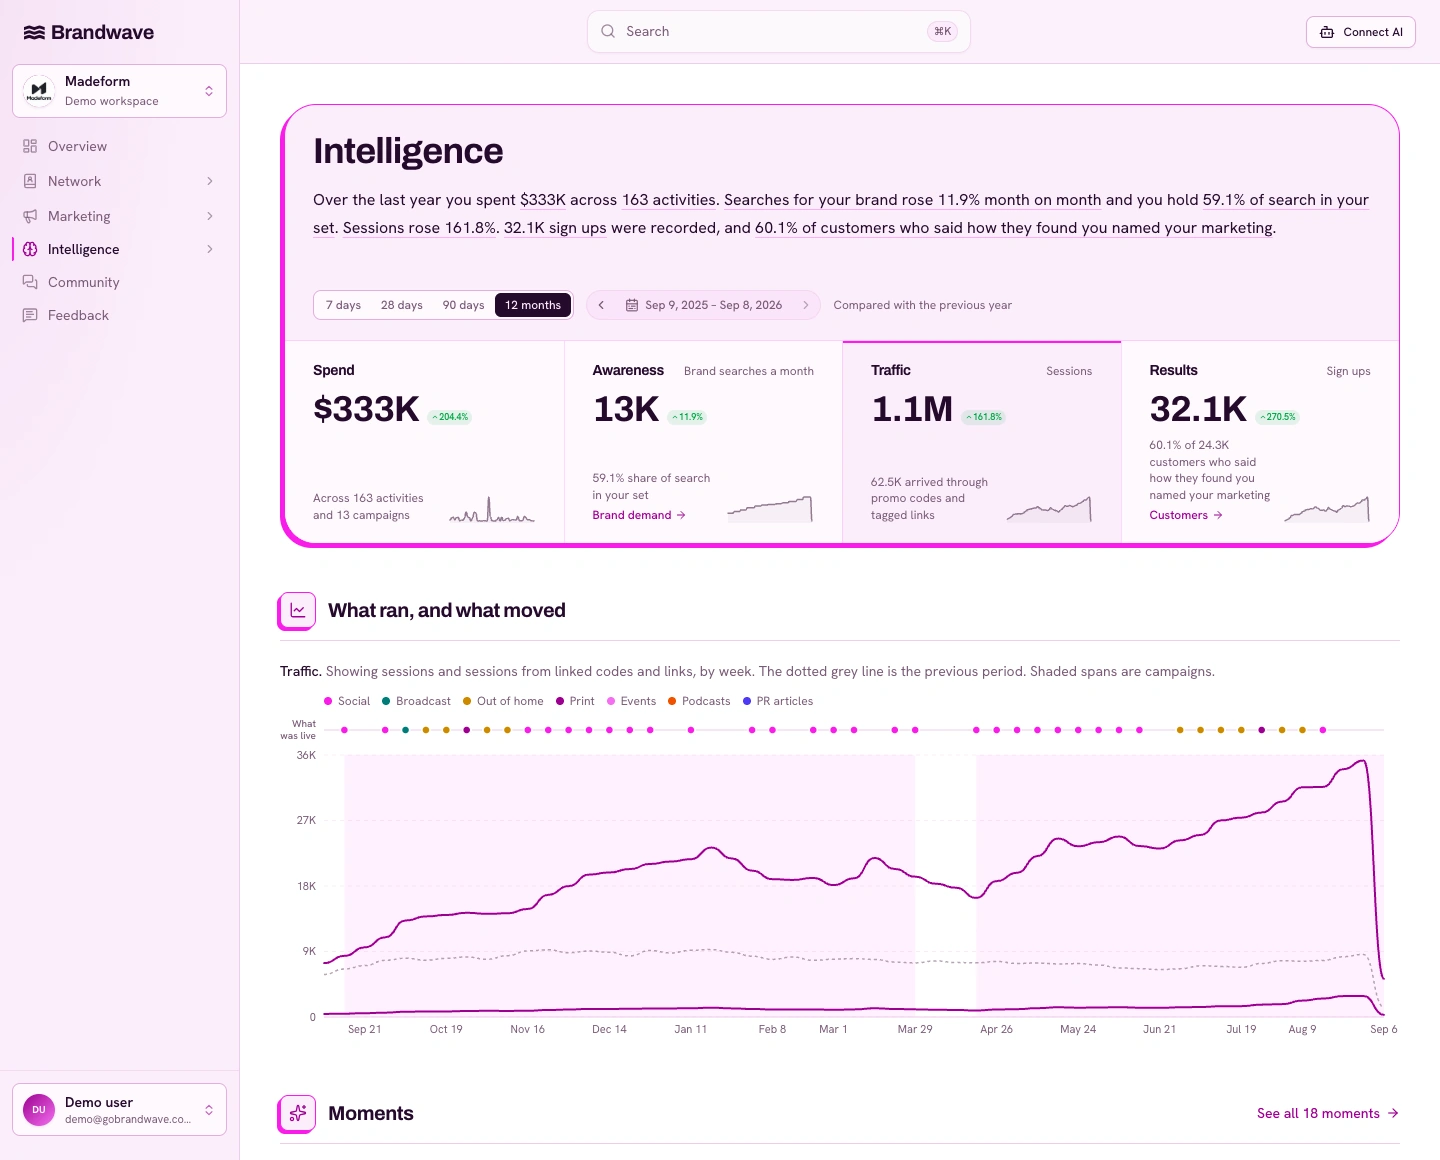
If I have just five minutes with a CEO or CFO, I don’t start with every creator’s engagement rate. I focus on the main points: what we spent, what we achieved, and how effectively we used the budget.
Then, I explain why these results matter for the business. Leadership cares about money, customers, and margins. If I’m reporting on awareness instead of direct sales, I make sure to clarify what we’re building and how it supports growth.
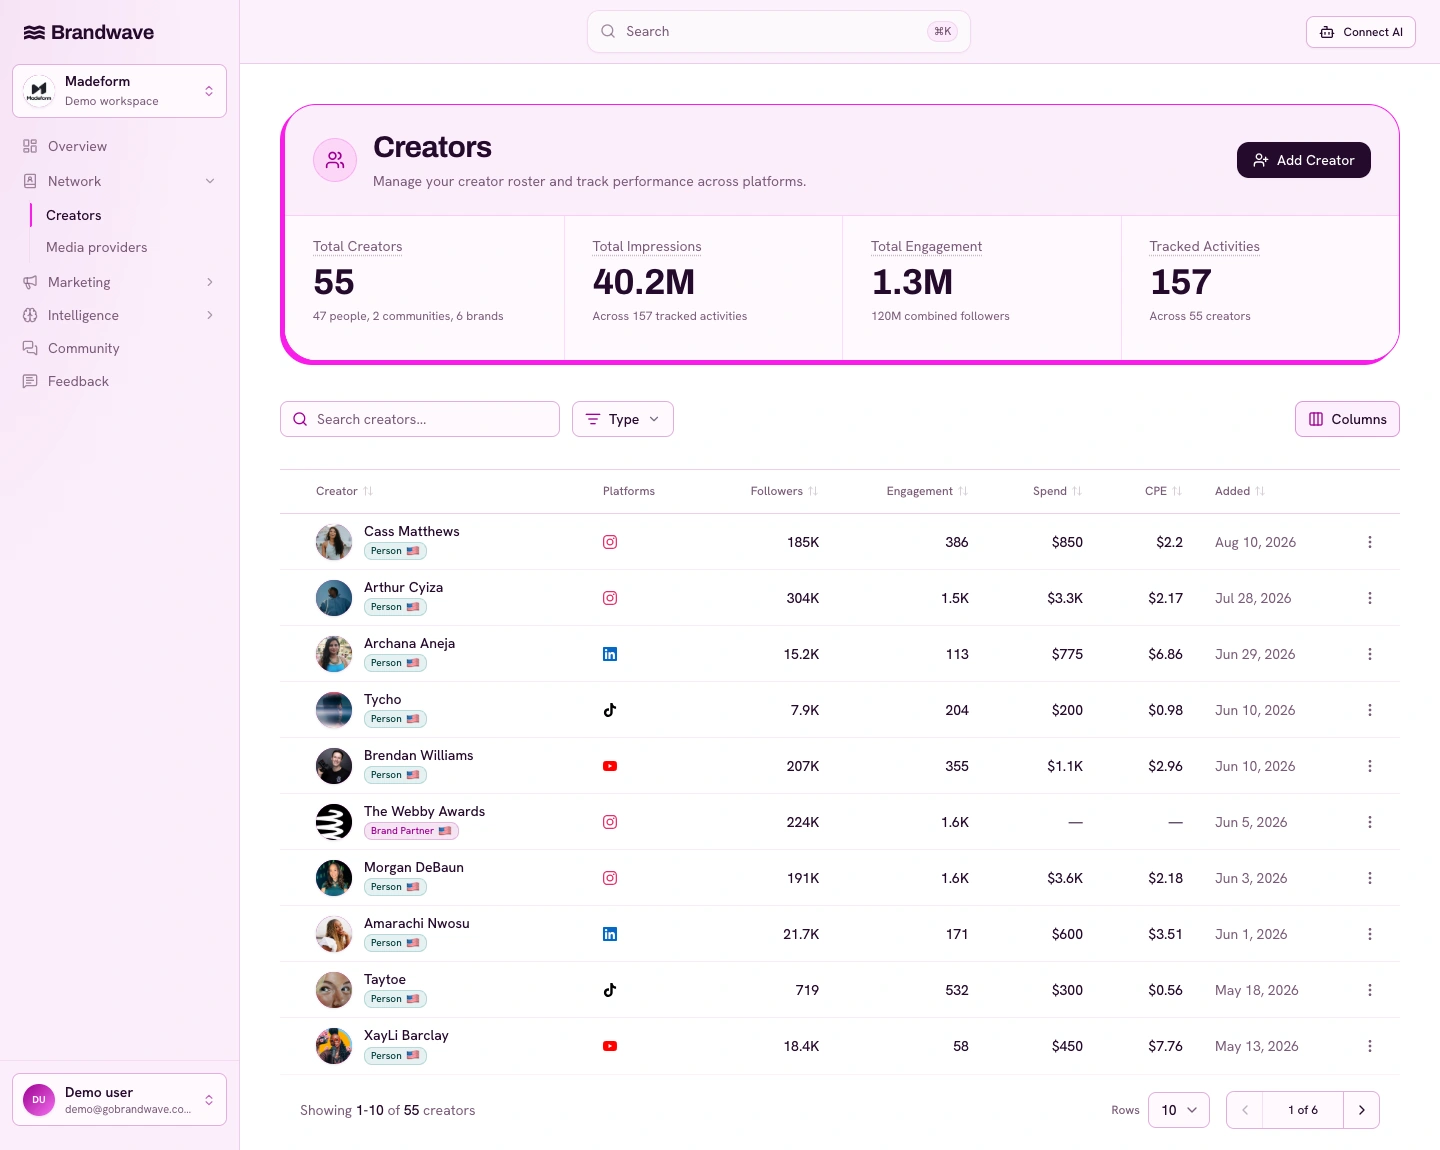
After that, I discuss the creators and channels. Who are we working with? Why did we pick them? Which regions and audiences do they reach, and how does that fit our target customers?
I want leadership to see that we choose different creators and channels for specific reasons. We’re not just buying posts and hoping for good numbers.
Spend and the overall result
- What we invested, what we received, and how that compares with our plan and previous performance.
The business value
- The customers, demand, content or relationships we’re building, and why those matter commercially.
The creator and channel mix
- Who we’re working with, why their audiences fit, and the role each channel plays.
The evidence behind the result
- What site activity, customer responses, tracked conversions and brand demand tell us together.
The next decision
- Where I would continue, change or stop investment, and when we’ll review the result.
| What I would show | What I want leadership to understand |
|---|---|
| Spend and the overall result | What we invested, what we received, and how that compares with our plan and previous performance. |
| The business value | The customers, demand, content or relationships we’re building, and why those matter commercially. |
| The creator and channel mix | Who we’re working with, why their audiences fit, and the role each channel plays. |
| The evidence behind the result | What site activity, customer responses, tracked conversions and brand demand tell us together. |
| The next decision | Where I would continue, change or stop investment, and when we’ll review the result. |
That’s the executive summary I want from an influencer reporting dashboard. I keep the details on hand for questions, but I don’t expect leadership to hunt for the main point.
Explain why these creators and channels matter
Marketing leaders usually understand why creator relationships matter, but people outside marketing might need more context. Creators build trust with their audience. Their followers know them, listen to them, and trust their recommendations.
I explain why we want to be part of that relationship. Follower count shows reach, but I also highlight the audience, region, the creator’s influence in our niche, and how well they fit our brand.
For an ecommerce business with a TikTok Shop, I might work with creators who can help people move from a product video to a purchase. For a SaaS business, I might want a respected person making useful YouTube content that people can keep finding through search.
These are different roles. If I don’t explain each one before showing the numbers, it’s easy for someone to judge both partnerships by the same short-term conversion goal.
I also explain the time frame. I once worked with a creator who had an affiliate code on an Instagram post and kept earning payouts years later. We often talk about how long YouTube content lasts, but I’ve seen the same with Instagram.
An influencer marketing ROI dashboard needs more than cheap conversions
As Head of Marketing, I look at how the different parts of the funnel connect. Something that seems expensive at first might turn out to be valuable later.
A creator might have a high cost per engagement, but the people who engage could convert well. Then I ask: do those customers stay? Do they bring good margins? Are they the right customers for us?
The opposite is true as well. Cheap conversions don’t help if those customers leave right away. I wouldn’t keep funding a partnership just because the acquisition numbers look good if the customer value isn’t there.
That’s why I don’t let one metric decide the program for me. An influencer marketing ROI dashboard should help me connect spending and results to what happens next. If customer or retention details are in our CRM or finance reports, I bring that into the conversation instead of assuming the social dashboard has the full answer.
The same thinking applies if our goal is to build demand instead of getting immediate sales. Are we growing an audience we can nurture? Are more people searching for us? Are we attracting the right people to our product? These are important to track, along with conversions.
The influencer marketing metrics I use, and what I pair them with
In my daily work, I check impressions, engagement, and cost per engagement. I know what normal results look like for us, but a CEO who sees these numbers only once a month doesn’t have that same context.
A high number of impressions can look impressive, even if they come from the wrong audience. No tracked conversions might seem like failure, even if the partnership was meant to build demand over time.
I use the same core numbers, but I explain them differently. I combine these influencer marketing KPIs instead of reporting them separately.
Spend
- What I use it for
- Keeping the program financially accountable
- What I look at alongside it
- Creator fees, production, product, commissions and promotion costs, plus the budget and actual delivery.
Content delivered
- What I use it for
- Checking what ran and when
- What I look at alongside it
- The agreed brief, publication dates, formats and the goal of each piece.
Impressions, views and reach
- What I use it for
- Understanding exposure and momentum
- What I look at alongside it
- Audience fit and the platform’s definition. I keep views, impressions and reach distinct.
Engagement
- What I use it for
- Seeing whether the audience is responding
- What I look at alongside it
- What people are saying, whether they are relevant, and what happens after the interaction.
CPE: spend divided by engagements
- What I use it for
- Comparing the cost of getting a response
- What I look at alongside it
- Similar creators and content on the same channel, then conversion and customer quality.
CPM: spend divided by impressions, multiplied by 1,000
- What I use it for
- Comparing the cost of exposure
- What I look at alongside it
- Comparable impression definitions, audience relevance and complete costs.
Conversions and customer quality
- What I use it for
- Understanding acquisition value
- What I look at alongside it
- The tracking method, acquisition cost, retention and margin where we have them.
HDYHAU responses
- What I use it for
- Hearing what customers remember bringing them to us
- What I look at alongside it
- Response coverage, the named creator or channel, and digital tracking reported separately.
Branded search, site traffic and newsletter signups
- What I use it for
- Looking for developing demand
- What I look at alongside it
- The campaign timeline, other activity running, the nurture plan and a review date.
| Metric or evidence | What I use it for | What I look at alongside it |
|---|---|---|
| Spend | Keeping the program financially accountable | Creator fees, production, product, commissions and promotion costs, plus the budget and actual delivery. |
| Content delivered | Checking what ran and when | The agreed brief, publication dates, formats and the goal of each piece. |
| Impressions, views and reach | Understanding exposure and momentum | Audience fit and the platform’s definition. I keep views, impressions and reach distinct. |
| Engagement | Seeing whether the audience is responding | What people are saying, whether they are relevant, and what happens after the interaction. |
| CPE: spend divided by engagements | Comparing the cost of getting a response | Similar creators and content on the same channel, then conversion and customer quality. |
| CPM: spend divided by impressions, multiplied by 1,000 | Comparing the cost of exposure | Comparable impression definitions, audience relevance and complete costs. |
| Conversions and customer quality | Understanding acquisition value | The tracking method, acquisition cost, retention and margin where we have them. |
| HDYHAU responses | Hearing what customers remember bringing them to us | Response coverage, the named creator or channel, and digital tracking reported separately. |
| Branded search, site traffic and newsletter signups | Looking for developing demand | The campaign timeline, other activity running, the nurture plan and a review date. |
I also want to know where each number comes from. Was it collected from the social media platform, provided by the creator, entered by our team, or estimated (which sometimes is all that is available)? Is anything missing? This helps me decide how much to trust each figure.
Our creator marketing measurement framework explains platform definitions and how activity, costs, and outcomes connect. For financial questions, I review it along with our guide to influencer marketing ROI.
Show HDYHAU alongside last-touch attribution
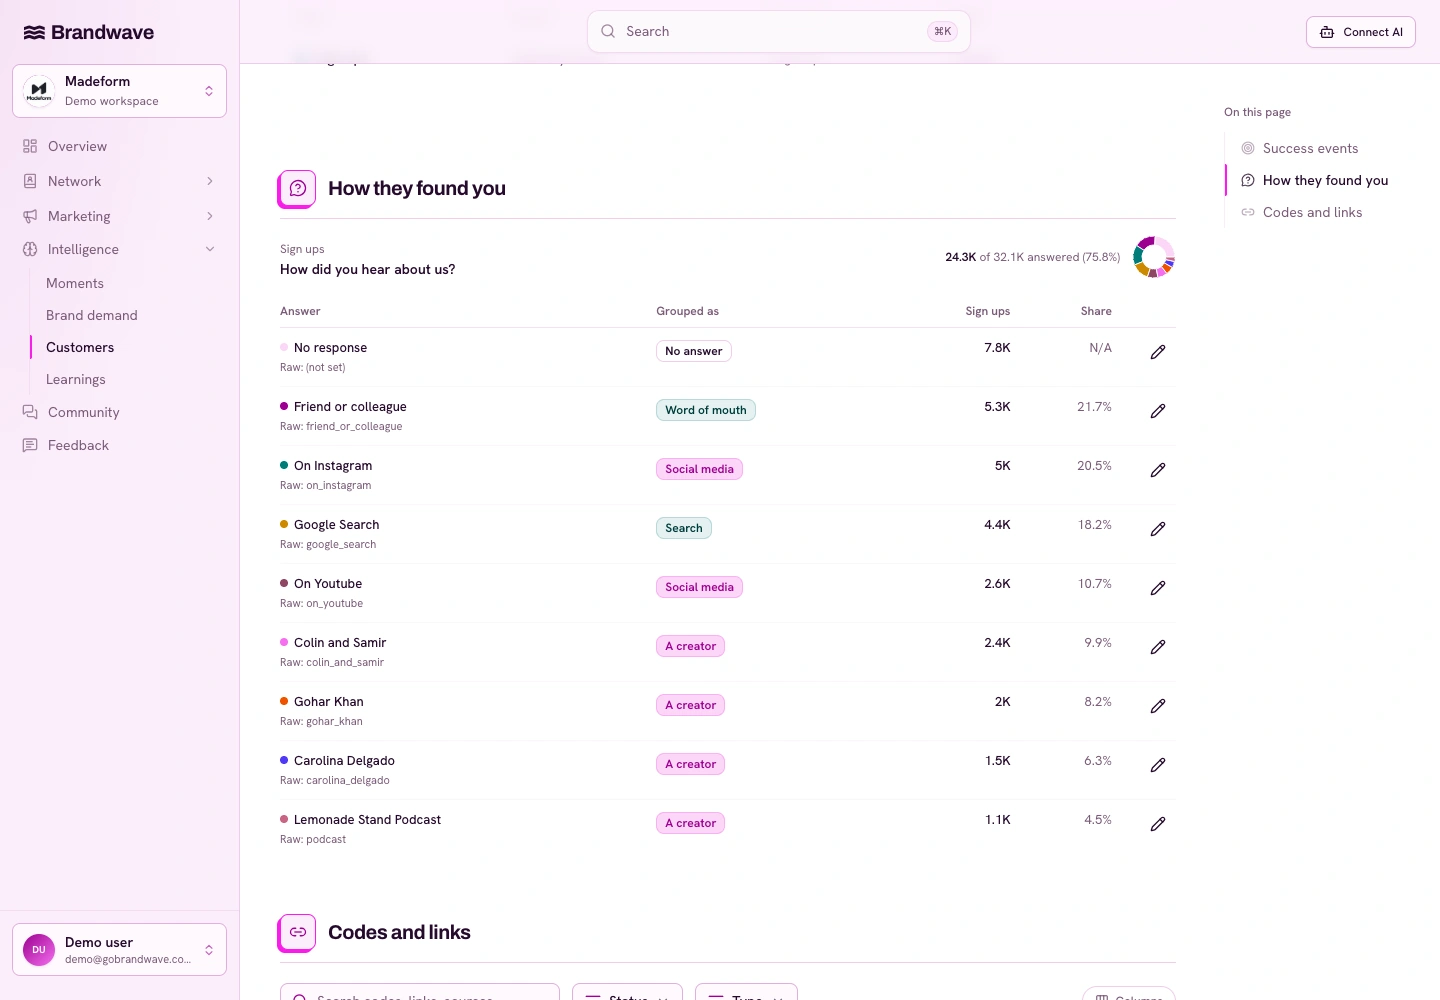
One of the most helpful things I show leadership is the difference between digital tracking and what customers say brought them to us.
HDYHAU means How Did You Hear About Us. It’s a simple question that can reveal a different story than the channel that got the final click.
Imagine a signup where the digital report shows Google Ads as the last touch, but the customer’s answer names a creator. I’d show those two pieces together and say: “The ad brought them to the signup, but look at who they remembered hearing about us from.”
This leads to a better conversation than arguing over which channel deserves all the credit. It helps people outside marketing see how the different layers work together. A creator can build interest that a later search or ad captures.
At Brandwave, I review HDYHAU responses and trends along with other outcome evidence. I don’t count a customer twice if they appear in two reports.
If you’re setting this up, our HDYHAU and GA4 guide explains how to collect and organize those responses.
Cohort analysis: what the Black Friday Olympics taught me
At one company, we ran an event called the Black Friday Olympics. All the creators aimed to drive signups, which let us see who was best at conversion messaging across the program.
But even with the same goal, the results needed context. Some creators were new partners with fresh audiences who hadn’t seen our product before. Others had worked with us longer and had already brought many interested followers to the product.
A new partner might get a lot of signups, while an established partner converts fewer people. That doesn’t mean the established partner is less effective. They may have already done much of the work.
If I only looked at the conversion totals from that event, I might reward newness and mistake it for a real difference in creator quality.
That’s why I use cohort analysis in an influencer campaign dashboard. A cohort is just a group with something important in common. I compare similar audience sizes in the same channel, review the content and goal, and separate new relationships from established ones.
Creator and audience tier
- Are these creators reaching similar types and sizes of audience?
Channel
- Am I comparing Instagram with Instagram, rather than treating a TikTok result as the same thing?
Content and campaign goal
- Were both pieces meant to drive signups, build awareness or do something else?
Partnership stage
- Is this a new audience, or has the creator already introduced many of their interested followers?
Time since publication
- Have both pieces had a comparable opportunity to deliver, including any longer-term search or affiliate activity?
Customer outcome
- Do the resulting customers stay and create value, or does the conversion total hide weak retention?
| Comparison | What I would check before choosing a winner |
|---|---|
| Creator and audience tier | Are these creators reaching similar types and sizes of audience? |
| Channel | Am I comparing Instagram with Instagram, rather than treating a TikTok result as the same thing? |
| Content and campaign goal | Were both pieces meant to drive signups, build awareness or do something else? |
| Partnership stage | Is this a new audience, or has the creator already introduced many of their interested followers? |
| Time since publication | Have both pieces had a comparable opportunity to deliver, including any longer-term search or affiliate activity? |
| Customer outcome | Do the resulting customers stay and create value, or does the conversion total hide weak retention? |
I still look at campaign totals because they show overall results, but I don’t use them as a shortcut to understand who did what, for which audience, and at what stage of the relationship.
Why I kept a partnership with weaker engagement
I once partnered with a creator who was a respected founder in our niche. Their reach and content were strong, but their engagement wasn’t as high as some of our other creators.
We continued the relationship anyway. As we worked together, we found value beyond social metrics. This person helped us connect with other creators and made useful introductions. They became a key contact in that market, making the partnership more than just a way to buy traffic or conversions.
I want to include that in leadership discussions. If the dashboard shows weaker engagement, I don’t hide it. I explain why I recommend continuing: the introductions, market access, and relationships are valuable for us.
I don’t need to assign a monetary value to every introduction. I just need to show what happened and why I believe it’s worth continuing. The numbers start the conversation, but they don’t replace my judgment.
What I say when there are no tracked conversions
No tracked conversions don’t mean nothing worked. Digital attribution is tricky, and last-touch reporting usually highlights the channel closest to the conversion.
If branded search and newsletter signups are rising, I show that evidence and explain our plan for using the demand. I set a timeline instead of asking leadership to fund awareness without an end point.
I might say: “We don’t have tracked conversions from this activity yet. We’re seeing more people search for us and join the newsletter. This quarter, I want to nurture that audience and see if they become customers. Here’s when we’ll review it.”
Then I look at the rest of the funnel. Are we following up with these people? Are our landing pages and signup process working well? If conversions are expensive elsewhere, maybe we need to build more demand instead of trying to get more from the same small group.
I put creator activity on the same timeline as our other marketing efforts. What happened before the change? What else was running? How long does it usually take someone to become a customer? This is more helpful than just flagging a creator for having no last-click sales.
I want marketing leaders to be trusted to make these decisions. My role is to bring the evidence, explain my reasoning, and agree on when we’ll review the decision.
Use the dashboard to stop, continue or change investment
A very high cost per engagement catches my attention. Was the content off? Did the audience not care? Was the creator a bad fit? I investigate before spending the same way again.
If engagement is expensive but those customers convert well and stay, I’m okay with it. If there’s audience pushback, apathy, and no good results later in the funnel, I’m much less comfortable. I look for signs worth building on, like relevant people responding, useful traffic, newsletter growth, strong customers, or a partnership that does more for us than the initial brief.
I also look at the bigger picture. Are our acquisition costs changing? Are competitors moving ahead? Are we building demand as fast as our peers? This context helps me decide if we’re making progress or need to rethink our channel strategy.
When a relationship has already reached most of its interested audience, the next step might be to change the content or find new audiences, not to call the creator a failure. The Black Friday example shows this well.
If the budget allows, I want to keep room for testing. Even a successful channel can reach its limit. I want to find the next opportunity before the current one ends.
Free influencer marketing reporting template
If you’re building your influencer reporting dashboard in a spreadsheet, start with a clear record of activities, costs, and results. Our free template includes an activity log, campaign rollups with CPE and CPM formulas, and a monthly leadership summary.
I use that as the numerical base, then add context: who the creators reach, each partnership's stage, the goal, and my recommended action.
Influencer marketing reporting template (XLSX)
Activities log, campaign rollup with CPE and CPM formulas, and a leadership summary sheet. No email required.
The influencer marketing dashboard examples here show how Brandwave brings spend, customer responses and creator performance together. We built these views to keep the evidence in one place, so we don’t have to rebuild it every time someone asks about the program.
With Brandwave’s creator marketing tools, I can review creator activity, spend, and performance alongside broader marketing and outcome data. If you’re setting up your own system, my guide to choosing an influencer marketing platform explains why I recommend investing in measurement before adding extra workflow automation.
No matter what tool I use, the standard stays the same. Can I explain what we spent, what we learned, and what I want to do next? That’s what I want the dashboard to help me with.
FAQ
Sources
- Meta Business Help Center: About Instagram insights (facebook.com)
- YouTube Help: Check your YouTube impressions and watch time (support.google.com)
- LinkedIn Help: Content analytics for your LinkedIn Page (linkedin.com)
- X Help Center: View counts (help.x.com)

Get the next article by email
Drop us your email and we'll let you know when we publish a new article.
By continuing you'll get an email for each new article and occasional product news from Brandwave. Unsubscribe any time. Privacy