On this page
- Download the campaign tracker
- Start with the decision, not the columns
- Set the workbook up in 30 minutes.
- What each of the nine tabs does
- Record channel metrics without creating a false total
- Keep outcomes and attribution separate.
- A fictional worked example
- The reporting rhythm
- When the spreadsheet stops working
- FAQ
Download the campaign tracker
Cross-channel marketing campaign tracker (XLSX)
You can open the file in Excel or import it into Google Sheets. The sample rows are just examples, so feel free to replace them with your own campaign data. Use this campaign tracking template to keep the same structure from planning through review.

Campaign plan
- Keeps the objective, hypothesis, audience, budget, owner, and decision date visible
Activities
- Records what actually ran without mixing unlike channel metrics into one total
Costs
- Separates committed and actual spend and keeps categories and currencies explicit
Outcomes
- Keeps observed business results and the attribution method attached to them
Direct and brand signals
- Preserves customer-reported and demand evidence that click paths often miss
Decision
- Turns reporting into a next action rather than an archive of campaign numbers
| What it records | Why it is separate |
|---|---|
| Campaign plan | Keeps the objective, hypothesis, audience, budget, owner, and decision date visible |
| Activities | Records what actually ran without mixing unlike channel metrics into one total |
| Costs | Separates committed and actual spend and keeps categories and currencies explicit |
| Outcomes | Keeps observed business results and the attribution method attached to them |
| Direct and brand signals | Preserves customer-reported and demand evidence that click paths often miss |
| Decision | Turns reporting into a next action rather than an archive of campaign numbers |
Start with the decision, not the columns
Before adding data from a platform, write down the decision this campaign record should help you make. For example, are you deciding whether to repeat the campaign, change channels, keep a partner, increase the budget, or stop an activity? Your decision will guide what evidence you need to track and when to review it.
Next, write your campaign hypothesis in a way that can be tested. For example: A coordinated creator and podcast launch will increase qualified trials and branded demand among operations leaders during September. This doesn't guarantee causality, but it helps your team know which activities, costs, outcomes, direct responses, and search signals to track together.
Choose one main outcome and a few supporting signals. For example, an awareness campaign might focus on reach, branded demand, and customer-reported discovery. A consideration campaign could track engaged visits, product exploration, demo requests, and direct responses. For a conversion campaign, focus on qualified trials, purchases, or pipeline, and always show the attribution method.
Should we repeat the launch?
- Primary evidence
- Primary outcome against the pre-campaign baseline
- Useful context
- Delivery, total cost, direct responses, brand demand, and other activity in market
Which creators or partners should we retain?
- Primary evidence
- Comparable activity and outcome evidence by partner
- Useful context
- Content type, audience, cost, reach, engagement, conversion method, and fit
Where should the next dollar go?
- Primary evidence
- Cost and outcome evidence across the portfolio
- Useful context
- Objective, confidence, time horizon, brand effect, and measurement blind spots
| Decision | Primary evidence | Useful context |
|---|---|---|
| Should we repeat the launch? | Primary outcome against the pre-campaign baseline | Delivery, total cost, direct responses, brand demand, and other activity in market |
| Which creators or partners should we retain? | Comparable activity and outcome evidence by partner | Content type, audience, cost, reach, engagement, conversion method, and fit |
| Where should the next dollar go? | Cost and outcome evidence across the portfolio | Objective, confidence, time horizon, brand effect, and measurement blind spots |
Set the workbook up in 30 minutes.
- Start by making a clean copy of the template. Keep the fictional example until you understand how the formulas work, then replace the sample rows instead of editing around them.
- Use stable IDs like CMP-001, ACT-001, and COST-001. While names might change, these IDs help keep your data connected and your history accurate.
- Pick one reporting currency and note the original transaction reference. If your campaigns use different currencies, set the conversion date and source before you compare costs.
- Set your organization’s reporting time zone. If you don’t, platform, analytics, and finance dates might place the same activity in different periods.
- Assign someone to be responsible for every campaign and every data source. If no one owns a field, it often gets ignored.
- Decide which platform metrics you can compare. Don’t combine reach, impressions, and views into a single total just because you have all three.
- Set your weekly check-in, campaign closeout date, and portfolio review date before you launch the campaign.
What each of the nine tabs does
This marketing tracker separates planning, delivery, costs, outcomes, evidence, and definitions so each part of the record stays clear.
Read Me
- What to enter
- Reporting currency, time zone, owner, setup choices, and update cadence
- Common mistake
- Deleting the instructions before the rest of the team understands the model
Campaigns
- What to enter
- Objective, hypothesis, audience, channels, dates, status, budget, target, and decision
- Common mistake
- Using a campaign name as the join key or omitting the decision date
Activities
- What to enter
- Channel, content type, partner, URL, publish date, delivery status, and raw metrics
- Common mistake
- Forcing every channel into the same metric or pasting totals without source dates
Costs
- What to enter
- Campaign/activity IDs, category, committed and actual amount, currency, date, and reference
- Common mistake
- Leaving internal time, production, usage, or agency cost outside the campaign total
Outcomes
- What to enter
- Observed metric, value, source, dimension, attribution method, confidence, and limitation
- Common mistake
- Labeling an attributed outcome as incremental or causal
Direct Signals
- What to enter
- HDYHAU, promo-code, sales-note, survey, or other direct evidence with privacy-safe detail
- Common mistake
- Copying personal customer data into a general reporting workbook
Brand Signals
- What to enter
- Metric, market, baseline and observation windows, values, source, and caveat
- Common mistake
- Treating one short-term movement as proof that the campaign caused brand lift
Dashboard
- What to enter
- Nothing: the summary and campaign table are formula-driven from the input tabs
- Common mistake
- Typing over formulas instead of correcting the source record
Definitions
- What to enter
- Your agreed field and metric definitions, source, owner, and comparability notes
- Common mistake
- Allowing each channel owner to use a different meaning for the same KPI
| Tab | What to enter | Common mistake |
|---|---|---|
| Read Me | Reporting currency, time zone, owner, setup choices, and update cadence | Deleting the instructions before the rest of the team understands the model |
| Campaigns | Objective, hypothesis, audience, channels, dates, status, budget, target, and decision | Using a campaign name as the join key or omitting the decision date |
| Activities | Channel, content type, partner, URL, publish date, delivery status, and raw metrics | Forcing every channel into the same metric or pasting totals without source dates |
| Costs | Campaign/activity IDs, category, committed and actual amount, currency, date, and reference | Leaving internal time, production, usage, or agency cost outside the campaign total |
| Outcomes | Observed metric, value, source, dimension, attribution method, confidence, and limitation | Labeling an attributed outcome as incremental or causal |
| Direct Signals | HDYHAU, promo-code, sales-note, survey, or other direct evidence with privacy-safe detail | Copying personal customer data into a general reporting workbook |
| Brand Signals | Metric, market, baseline and observation windows, values, source, and caveat | Treating one short-term movement as proof that the campaign caused brand lift |
| Dashboard | Nothing: the summary and campaign table are formula-driven from the input tabs | Typing over formulas instead of correcting the source record |
| Definitions | Your agreed field and metric definitions, source, owner, and comparability notes | Allowing each channel owner to use a different meaning for the same KPI |
Record channel metrics without creating a false total
The Activities tab keeps impressions, reach, views, engagements, and clicks in separate columns because each platform defines and counts them differently. For example, on the same platform, an impression might mean repeat exposure, while reach shows unique accounts. A video view depends on playback rules, and engagement rate might use impressions, reach, followers, or views as its base.
Keep the original metric name and its source date. When comparing creators, content, or campaigns, make sure you compare similar metrics. If leadership wants a summary, show separate groups or use a clearly defined index instead of adding views and reach together and calling it audience.
Cost metrics only make sense if both the numerator and denominator are accurate. CPE means actual campaign or activity cost divided by comparable engagements. CPM is actual cost divided by comparable impressions, then multiplied by 1,000. If you don’t have the denominator, leave the metric blank instead of making it zero.
CPE = actual cost ÷ comparable engagements
CPM = (actual cost ÷ comparable impressions) × 1,000
Keep outcomes and attribution separate.
An outcome is a business result you can see, like a qualified trial, purchase, demo request, pipeline amount, retained customer, branded search, or another agreed metric. Attribution is the method you use to link some of that outcome to marketing. The workbook tracks both, because just looking at the value can give a false sense of certainty.
Label your methods clearly, like last non-direct click, UTM campaign, promo code, customer-reported source, sales-assigned source, platform-reported conversion, matched holdout, or no attribution. Also, add any limitations in simple language. For example, say if a platform reports conversions within a seven-day click window or if there are overlaps with GA4 totals. This is more helpful than just adding a confidence badge without explanation.
Keep direct evidence next to click-path evidence, not mixed together. For example, a customer might say they heard about your business on a podcast but later convert through branded search. By keeping the direct response, search session, and outcome separate, your team can compare them instead of letting one overwrite the others.
Implement direct tracking
Add practical evidence without pretending it can see everything.
Use a measurement framework.
Make sure creators, activities, costs, and outcomes stay linked, but don’t claim a direct cause unless you have clear proof.
A fictional worked example
The sample campaign in the workbook, called Spring Launch, is fictional. It includes creator partnerships, a podcast placement, paid social, and an event. The campaign plan lists a hypothesis about qualified trials and branded demand, a $32,000 planned budget, owners, dates, and a closeout decision.
The Activities tab shows what each channel delivered, without forcing every row to use the same metrics. For example, creator videos track views and engagements, paid social tracks impressions and clicks, and event attendance is recorded in the notes instead of as a social metric. Costs are linked to the campaign and, when possible, to the specific activity.
The Outcomes tab tracks qualified trials and purchases, along with their source and attribution method. Direct Signals includes privacy-safe HDYHAU and promo-code totals. Brand Signals compares a set branded-search baseline with the observation window and notes that other activities or seasonality could also explain the results.
The dashboard compares planned and actual costs, delivery, raw channel data, and outcomes for each campaign. It doesn’t pick a winner. The decision column shows what the team decided and why, keeping the conclusion linked to the evidence available at that time.
The reporting rhythm
As a marketing reporting template, the workbook supports different review cadences without mixing weekly upkeep with campaign, monthly, or quarterly decisions.
Weekly hygiene
- What to do
- Add delivered activities and costs, refresh available metrics, resolve missing IDs, and record context
- What not to do
- Rewrite the campaign hypothesis after seeing early numbers
Campaign closeout
- What to do
- Reconcile finance, complete outcome and direct-signal windows, note limitations, and record the decision
- What not to do
- Close the report while invoices or conversion windows are still incomplete
Monthly portfolio review
- What to do
- Compare campaigns with similar objectives, evidence, and time horizons; decide what needs deeper analysis
- What not to do
- Rank every channel by one blended metric regardless of its job
Quarterly governance
- What to do
- Review definitions, owners, source access, privacy, formulas, and fields nobody uses
- What not to do
- Add columns indefinitely without retiring obsolete definitions
| Cadence | What to do | What not to do |
|---|---|---|
| Weekly hygiene | Add delivered activities and costs, refresh available metrics, resolve missing IDs, and record context | Rewrite the campaign hypothesis after seeing early numbers |
| Campaign closeout | Reconcile finance, complete outcome and direct-signal windows, note limitations, and record the decision | Close the report while invoices or conversion windows are still incomplete |
| Monthly portfolio review | Compare campaigns with similar objectives, evidence, and time horizons; decide what needs deeper analysis | Rank every channel by one blended metric regardless of its job |
| Quarterly governance | Review definitions, owners, source access, privacy, formulas, and fields nobody uses | Add columns indefinitely without retiring obsolete definitions |
When the spreadsheet stops working
- Nobody can explain which copy is current or who changed a formula.
- The weekly refresh consumes more time than interpreting the result.
- Campaign, activity, cost, and outcome IDs no longer reconcile across owners.
- Platform history disappears before the team captures it, or screenshots become the archive.
- Leadership asks a follow-up question that requires rebuilding the report from raw exports.
- Direct responses, brand signals, and offline activity live in separate files and never reach the same review.
- The team cannot give an AI assistant or developer governed access without sharing the whole workbook.
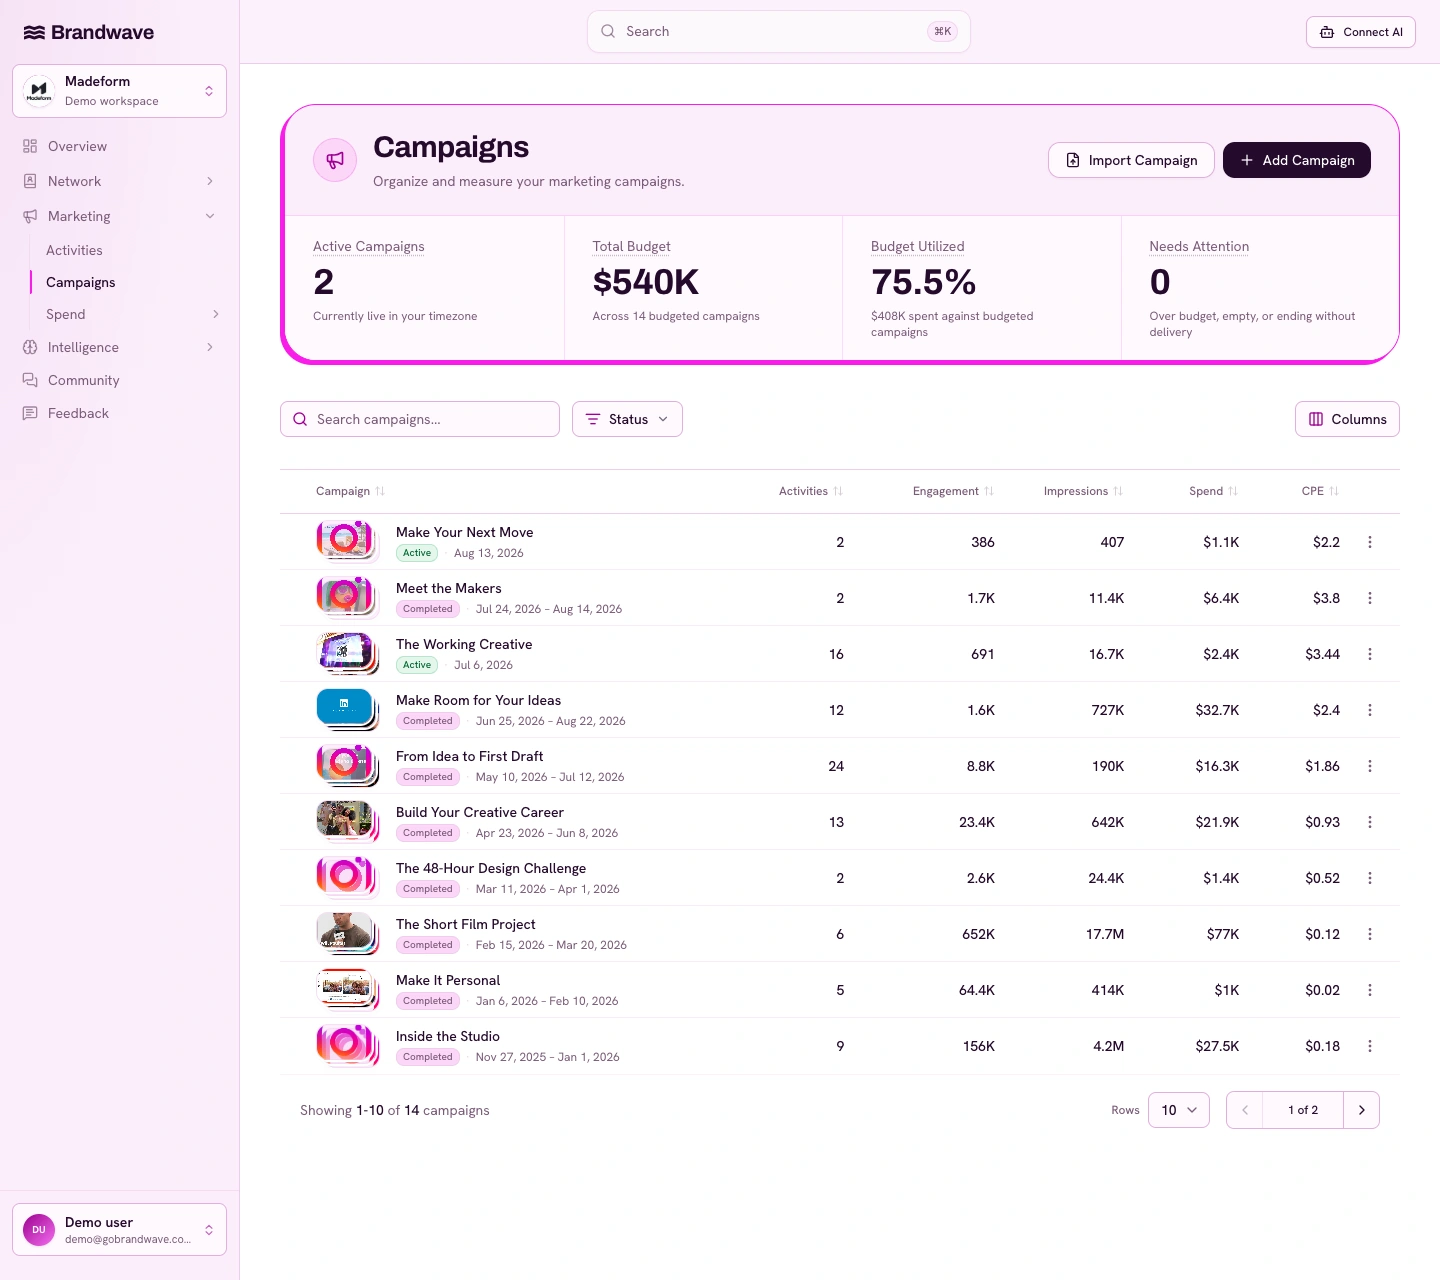
This is why it’s helpful to move from a campaign spreadsheet to a managed marketing record. Brandwave lets you track campaigns, activities, creators, costs, success metrics, direct evidence, and brand-demand signals all on one timeline. The current automation covers Instagram, YouTube, TikTok, X, LinkedIn, and Reddit, but you can add other channels too. You can access the same record through the web app, HTTP API, and MCP server for authorized AI assistants.
A system won’t replace the need for clear definitions or good judgment. But it does remove fragile links and repeated copying, so your team can focus on making decisions. Check out Brandwave pricing or compare it with other marketing dashboard and reporting tools.
FAQ
Sources
- Google Analytics Help: campaign URL builder and UTM parameter guidance (support.google.com)
- Meta Business Help Center: About Instagram insights (facebook.com)
- YouTube Help: Check your YouTube impressions and watch time (support.google.com)
- LinkedIn Help: Content analytics for your LinkedIn Page (linkedin.com)
- X Help Center: View counts (help.x.com)
- Brandwave influencer marketing measurement framework (gobrandwave.com)
Get the next article by email
Drop us your email and we'll let you know when we publish a new article.
By continuing you'll get an email for each new article and occasional product news from Brandwave. Unsubscribe any time. Privacy