On this page
- What brand measurement covers
- Choose each metric for the question it can answer.
- Survey-based brand tracking
- Branded search and Share of Search
- Add evidence that click attribution misses.
- Use brand-lift experiments for a narrower causal question.
- A minimum viable system for a smaller team
- What a mature measurement stack adds
- Set the baseline in four weeks.
- Run a monthly decision review.
- Where Brandwave fits
- FAQ
What brand measurement covers
Awareness
- Question
- Do category buyers recognize or recall us?
- Useful measures
- Aided and unaided awareness
- What it does not prove
- That the brand comes to mind in a buying situation
Salience
- Question
- How readily does the brand come to mind in relevant situations?
- Useful measures
- Category-entry-point association, mental availability, spontaneous recall
- What it does not prove
- Preference or purchase
Consideration
- Question
- Would eligible buyers seriously consider us?
- Useful measures
- Consideration set, familiarity, relevance
- What it does not prove
- That stated intent will become demand
Preference
- Question
- Do people choose us over alternatives in a stated comparison?
- Useful measures
- Preference, associations, perceived difference
- What it does not prove
- Observed purchasing behavior
Demand
- Question
- Are more people actively seeking the brand?
- Useful measures
- Branded search, direct visits, inquiries, Share of Search
- What it does not prove
- Why demand moved or who caused it
Business outcomes
- Question
- Did attention and demand become valuable action?
- Useful measures
- Qualified pipeline, revenue, retention, selected success events
- What it does not prove
- That brand activity was the only cause
| Stage | Question | Useful measures | What it does not prove |
|---|---|---|---|
| Awareness | Do category buyers recognize or recall us? | Aided and unaided awareness | That the brand comes to mind in a buying situation |
| Salience | How readily does the brand come to mind in relevant situations? | Category-entry-point association, mental availability, spontaneous recall | Preference or purchase |
| Consideration | Would eligible buyers seriously consider us? | Consideration set, familiarity, relevance | That stated intent will become demand |
| Preference | Do people choose us over alternatives in a stated comparison? | Preference, associations, perceived difference | Observed purchasing behavior |
| Demand | Are more people actively seeking the brand? | Branded search, direct visits, inquiries, Share of Search | Why demand moved or who caused it |
| Business outcomes | Did attention and demand become valuable action? | Qualified pipeline, revenue, retention, selected success events | That brand activity was the only cause |
These stages are connected, but they do not always happen in the same order. For example, people might notice a brand more without liking it more. Search demand can increase after a news story, not just because of a campaign. Revenue might rise even if brand health stays the same, due to factors like distribution, pricing, sales team efforts, or the economy.
This is why a brand dashboard should track the source, market, time period, method, and any notes for each number, rather than combining everything into a single score.
Choose each metric for the question it can answer.
Aided and unaided awareness surveys
- What it measures
- Stated recognition and recall in a defined population
- Typical cadence
- Monthly to quarterly
- Strength
- Direct measure of a named construct
- Main blind spot
- Sampling, wording, panel quality, and wave-to-wave noise
Consideration, preference, and associations
- What it measures
- Stated evaluation and brand meaning
- Typical cadence
- Monthly to quarterly
- Strength
- Shows where perception is changing
- Main blind spot
- Stated answers are not observed behavior
Branded search demand
- What it measures
- Search behavior for defined brand terms
- Typical cadence
- Monthly
- Strength
- Behavioral, comparable over time, market-specific
- Main blind spot
- Naming ambiguity, seasonality, publicity, and platform estimates
Share of Search
- What it measures
- A brand’s share of branded-search demand inside a fixed competitor set
- Typical cadence
- Monthly
- Strength
- Adds relative category context
- Main blind spot
- Competitor and term definitions can change the result; it is not market share
Social listening and media
- What it measures
- Conversation, coverage, reach, sentiment, and associations in covered sources
- Typical cadence
- Daily to monthly
- Strength
- Fast narrative and issue detection
- Main blind spot
- Query bias, source coverage, spam, and unrepresentative voices
Direct traffic and site behavior
- What it measures
- Visits and actions without an attributable referring click
- Typical cadence
- Weekly to monthly
- Strength
- Observed owned-property behavior
- Main blind spot
- Browsers and analytics often misclassify the source
HDYHAU and sales notes
- What it measures
- What customers say introduced or influenced them
- Typical cadence
- Continuous; review monthly
- Strength
- Restores sources that click attribution can miss
- Main blind spot
- Recall, response coverage, free-text cleaning, and self-report bias
Brand-lift experiments
- What it measures
- Incremental change for an eligible campaign and population
- Typical cadence
- Per campaign
- Strength
- A designed causal comparison
- Main blind spot
- Power, eligibility, platform scope, and limited generalisability
Commercial outcomes
- What it measures
- Pipeline, revenue, retention, or defined success events
- Typical cadence
- Weekly to monthly
- Strength
- Connects measurement to business value
- Main blind spot
- Many marketing and non-marketing factors move the result
| Method or signal | What it measures | Typical cadence | Strength | Main blind spot |
|---|---|---|---|---|
| Aided and unaided awareness surveys | Stated recognition and recall in a defined population | Monthly to quarterly | Direct measure of a named construct | Sampling, wording, panel quality, and wave-to-wave noise |
| Consideration, preference, and associations | Stated evaluation and brand meaning | Monthly to quarterly | Shows where perception is changing | Stated answers are not observed behavior |
| Branded search demand | Search behavior for defined brand terms | Monthly | Behavioral, comparable over time, market-specific | Naming ambiguity, seasonality, publicity, and platform estimates |
| Share of Search | A brand’s share of branded-search demand inside a fixed competitor set | Monthly | Adds relative category context | Competitor and term definitions can change the result; it is not market share |
| Social listening and media | Conversation, coverage, reach, sentiment, and associations in covered sources | Daily to monthly | Fast narrative and issue detection | Query bias, source coverage, spam, and unrepresentative voices |
| Direct traffic and site behavior | Visits and actions without an attributable referring click | Weekly to monthly | Observed owned-property behavior | Browsers and analytics often misclassify the source |
| HDYHAU and sales notes | What customers say introduced or influenced them | Continuous; review monthly | Restores sources that click attribution can miss | Recall, response coverage, free-text cleaning, and self-report bias |
| Brand-lift experiments | Incremental change for an eligible campaign and population | Per campaign | A designed causal comparison | Power, eligibility, platform scope, and limited generalisability |
| Commercial outcomes | Pipeline, revenue, retention, or defined success events | Weekly to monthly | Connects measurement to business value | Many marketing and non-marketing factors move the result |
How often you measure should match the decision you need to make and how stable the data is. For example, showing survey results every day can make things seem urgent, even though a three-month average is more reliable. Waiting six months to run a campaign experiment after a media decision is usually too late to be useful.
Use the baseline and observation periods in the downloadable matrix to make each comparison clear.
Survey-based brand tracking
Survey tracking is the direct route to constructs such as unaided awareness, aided awareness, familiarity, consideration, preference, and brand associations. It is appropriate when the decision genuinely depends on what a defined population remembers or believes.
The survey tool is just as important as the software you use. Keep your target group, screening rules, question wording and order, answer choices, sample source, weighting, and survey timing the same every time. Always note any major changes. A small change in results does not always mean something important happened, even if the dashboard shows a trend.
Continuous tracking tools process data in different ways. For example, Tracksuit collects data all the time, updates results each month, and reports a three-month rolling average. YouGov BrandIndex tracks brands daily using thousands of interviews in 56 markets. These methods are different, so you cannot compare their results directly.
Use a survey specialist if you need to measure awareness or perception across a whole population. Brandwave does not run a consumer panel and should not be used for this purpose.
- Define the buyer population before the questionnaire.
- Keep aided and unaided measures separate.
- Use consistent category-entry points and competitor prompts.
- Review sample size, weighting, confidence intervals, and minimum detectable change.
- Keep raw wave data and methodology notes, not only the latest score.
Branded search and Share of Search
Share of Search = brand search demand ÷ total search demand for the fixed competitor set × 100
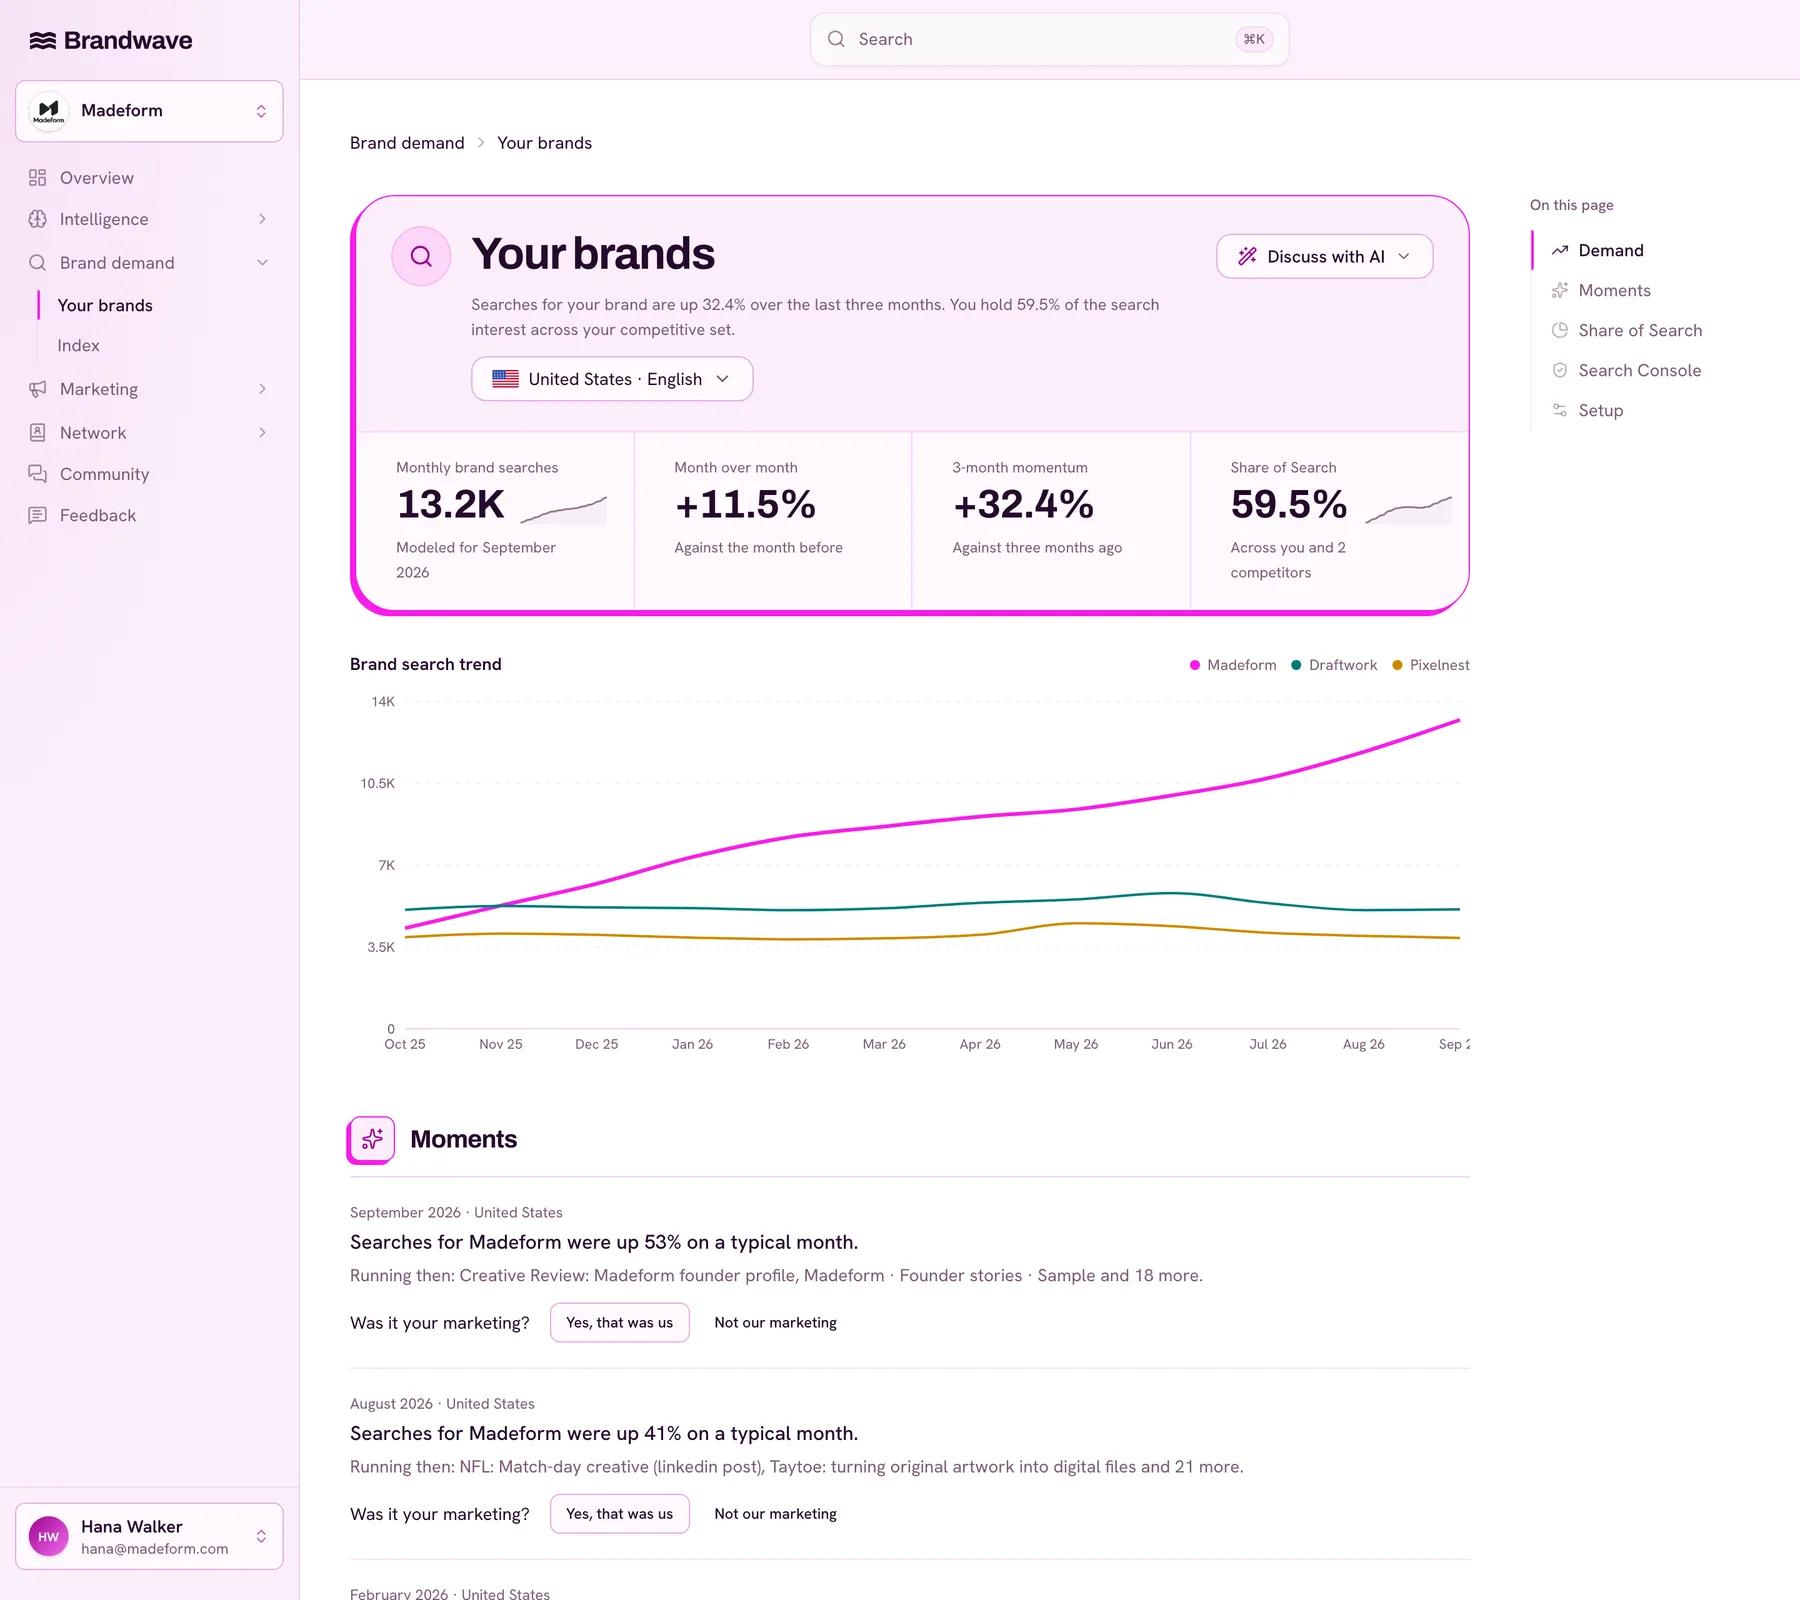
Branded search is a behavioral demand signal: people deliberately enter brand-related terms. Share of Search places that demand inside a category by comparing the brand with a defined competitor set in the same market and period.
It is very important to define your terms. Write down which names, unclear terms, product brands, misspellings, locations, languages, and competitor changes you include. Keep your list steady long enough to build a good baseline. Also, keep absolute brand demand and relative Share of Search separate so you can see if the whole category is rising or falling.
Google Trends adjusts search interest by time and location, showing scaled results instead of raw numbers. Third-party estimates use their own models. First-party Search Console data shows searches that led to impressions for your site. Do not treat these as the same kind of measurement or combine them.
Share of Search can provide helpful clues, but it does not always predict market share or prove that a campaign caused demand. If you see a sudden change, check your campaigns, PR, promotions, seasonality, product updates, and what competitors are doing.
Add evidence that click attribution misses.
HDYHAU
- Best use
- Identify sources customers remember at a meaningful event
- Quality check
- Response coverage, raw wording, normalization rules, and unknown share
Sales and customer-success notes
- Best use
- Find repeated language, objections, and introduction paths
- Quality check
- Consistent prompts, sample bias, and connection to an account or period
Customer interviews
- Best use
- Explain why perceptions or choices changed
- Quality check
- Recruitment, interviewer bias, and separation of observation from interpretation
Direct and dark-social traffic
- Best use
- Detect demand without a clean referrer
- Quality check
- Landing pages, tagging discipline, browser loss, and bot filtering
Promo codes and tagged links
- Best use
- Observe explicit campaign or partner response
- Quality check
- Code leakage, link sharing, expiry, and denominator
Social and media evidence
- Best use
- Understand narrative, visibility, and issues
- Quality check
- Coverage, query definitions, duplicated content, and representativeness
| Evidence | Best use | Quality check |
|---|---|---|
| HDYHAU | Identify sources customers remember at a meaningful event | Response coverage, raw wording, normalization rules, and unknown share |
| Sales and customer-success notes | Find repeated language, objections, and introduction paths | Consistent prompts, sample bias, and connection to an account or period |
| Customer interviews | Explain why perceptions or choices changed | Recruitment, interviewer bias, and separation of observation from interpretation |
| Direct and dark-social traffic | Detect demand without a clean referrer | Landing pages, tagging discipline, browser loss, and bot filtering |
| Promo codes and tagged links | Observe explicit campaign or partner response | Code leakage, link sharing, expiry, and denominator |
| Social and media evidence | Understand narrative, visibility, and issues | Coverage, query definitions, duplicated content, and representativeness |
How Did You Hear About Us (HDYHAU) works best when you ask it soon after an important event and keep the customer's original words. You can standardize answers to make reporting easier, but do not replace the original response or turn categories into attribution without saying so.
Brandwave retrieves raw and normalized GA4 HDYHAU values, response coverage, creator relevance, data-quality flags, and a daily evidence timeline. Reusable mappings classify future responses. The workflow explicitly does not assign conversions to creators or campaigns.
Brandwave also discovers directly observed GA4 evidence from promo codes and manually tagged UTM links, supports explicit mappings, and lets teams triage noise with ignore and restore actions. This is observed evidence, not inferred causation. See the practical HDYHAU in GA4 guide for implementation details.
Use brand-lift experiments for a narrower causal question.
A well-powered brand-lift experiment asks whether an eligible campaign changed a defined metric for the exposed population relative to a control. It answers a narrower causal question than a trend line.
Google describes Brand Lift as a free tool for eligible Video and Demand Gen campaigns that measures goals such as ad recall, awareness, association, and consideration. Eligibility, minimum spend, survey response, study design, and platform population all constrain the result.
Do not rely only on before-and-after differences to claim a lift. A before-and-after chart can show trends, but it does not account for all other changes. Brandwave tracks campaign activity, costs, outcomes, and related signals, but it is not a brand-lift experiment tool. Use results from specialist experiments as one piece of evidence in your decision-making.
A minimum viable system for a smaller team
- One decision: name the budget or message choice the system must support.
- One market and category: write the buyer population and fixed competitor set.
- One perception measure: run a consistent quarterly survey if the decision needs awareness or consideration.
- One demand measure: track branded search and Share of Search monthly.
- One direct-customer measure: collect HDYHAU at a meaningful success event and retain raw answers.
- One business outcome: select the GA4 success event, qualified pipeline measure, or revenue definition that matters.
- One monthly review: compare signals, confounders, confidence, and the resulting action.
A spreadsheet can handle this system when things are simple and there is not too much data. Most problems come from missing definitions, scattered records, unclear ownership, or not recording decisions, not from the spreadsheet itself.
Download the matrix below, replace the examples, and resist adding another metric until it changes a real decision.
Brand measurement source matrix
Define each business question, market, competitor set, source, baseline, cadence, owner, confounder, confidence level, and supported decision. Includes a formula-driven monthly review.
What a mature measurement stack adds
Continuous brand tracker
- Adds
- Stable perception and category measures
- Governance question
- Are sample, weighting, questionnaire, and breaks documented?
Search-demand system
- Adds
- Absolute demand, competitor Share of Search, geography, and history
- Governance question
- Are names, markets, estimates, and first-party observations distinct?
Social and media intelligence
- Adds
- Conversation, associations, reach, and narrative
- Governance question
- Are queries, sources, spam rules, and gaps reviewable?
Customer evidence
- Adds
- HDYHAU, qualitative research, sales notes, and direct signals
- Governance question
- Can reviewers trace a category back to raw evidence?
Experiments and modeling
- Adds
- Incrementality, campaign lift, attribution, or econometric estimates
- Governance question
- Are assumptions, eligibility, power, and uncertainty explicit?
Marketing intelligence record
- Adds
- Activity, spend, outcomes, evidence, comparisons, and decisions
- Governance question
- Can a stakeholder ask what changed, why confidence differs, and what action followed?
| Layer | Adds | Governance question |
|---|---|---|
| Continuous brand tracker | Stable perception and category measures | Are sample, weighting, questionnaire, and breaks documented? |
| Search-demand system | Absolute demand, competitor Share of Search, geography, and history | Are names, markets, estimates, and first-party observations distinct? |
| Social and media intelligence | Conversation, associations, reach, and narrative | Are queries, sources, spam rules, and gaps reviewable? |
| Customer evidence | HDYHAU, qualitative research, sales notes, and direct signals | Can reviewers trace a category back to raw evidence? |
| Experiments and modeling | Incrementality, campaign lift, attribution, or econometric estimates | Are assumptions, eligibility, power, and uncertainty explicit? |
| Marketing intelligence record | Activity, spend, outcomes, evidence, comparisons, and decisions | Can a stakeholder ask what changed, why confidence differs, and what action followed? |
A mature system focuses on better cross-checking and management, not just adding more charts. Independent signals might not always match, and that is okay. For example, a survey might show steady awareness while search demand goes up. This difference could mean there is a small active audience, a publicity boost, a change in distribution, or a measurement issue to look into.
Let each specialist system do what it does best. The system that connects them should keep their methods clear and make it easier to review all the data as a whole.
Set the baseline in four weeks.
1
- Work
- Define the decision, buyer population, market, category, competitor set, owner, and review cadence
- Output
- Measurement brief
2
- Work
- Inventory current surveys, search terms, Search Console, GA4 success metrics, HDYHAU, direct signals, campaign records, and commercial outcomes
- Output
- Source map and access gaps
3
- Work
- Backfill comparable history, document breaks, normalize only where rules are reusable, and flag known confounders
- Output
- Baseline with provenance
4
- Work
- Run the first review, record disagreement, set confidence, choose an action, owner, and due date
- Output
- Decision record
| Week | Work | Output |
|---|---|---|
| 1 | Define the decision, buyer population, market, category, competitor set, owner, and review cadence | Measurement brief |
| 2 | Inventory current surveys, search terms, Search Console, GA4 success metrics, HDYHAU, direct signals, campaign records, and commercial outcomes | Source map and access gaps |
| 3 | Backfill comparable history, document breaks, normalize only where rules are reusable, and flag known confounders | Baseline with provenance |
| 4 | Run the first review, record disagreement, set confidence, choose an action, owner, and due date | Decision record |
Use the first month as a baseline, not as a way to judge performance. Do not change how you define metrics just because you see an unexpected result. If there is a major change in the market, survey, tracking, or competitor set, record it and start a new series for comparison.
Run a monthly decision review.
- What changed in absolute terms and relative to the baseline?
- Which independent signals agree, and which disagree?
- Did the market, competitor set, sample, campaign mix, tracking, product, price, distribution, or news environment change?
- What is observed, estimated, self-reported, modeled, or experimental?
- How confident are we, and what evidence would change that confidence?
- What will we investigate, maintain, increase, reduce, or stop?
- Who owns the action, and when will we review the decision?
Where Brandwave fits
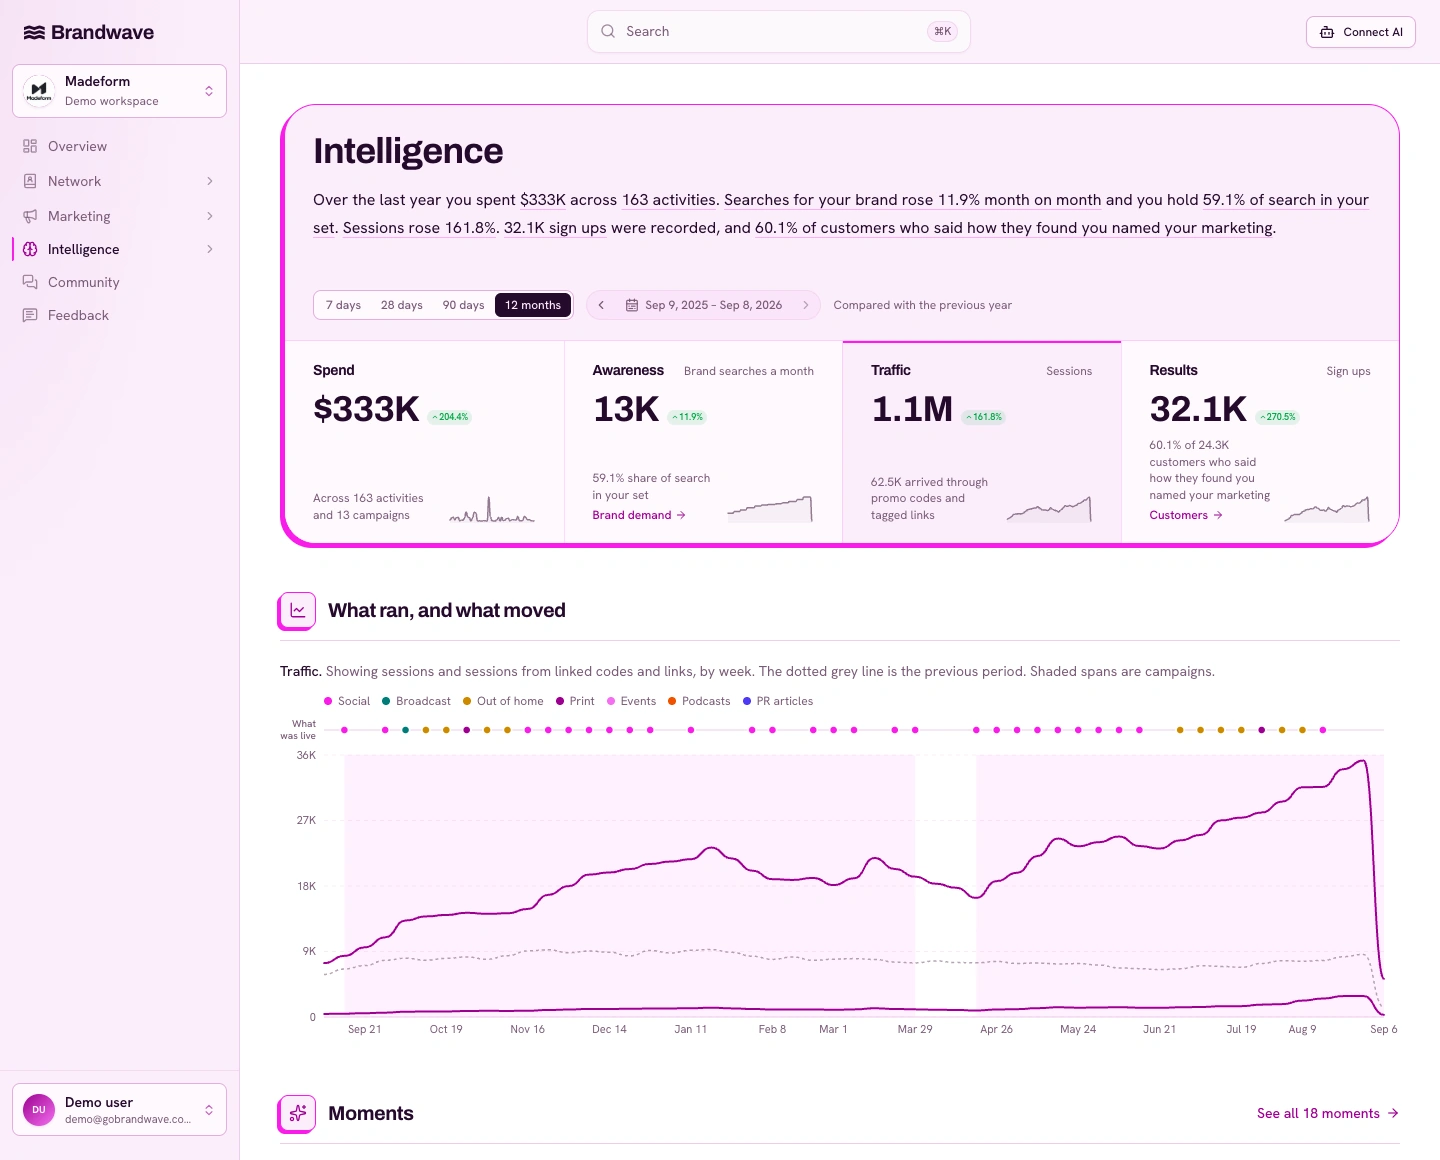
Brandwave serves as the marketing intelligence layer that connects your work with the evidence behind your decisions. It does more than just track Share of Search. Teams can manage campaigns, activities, creators, costs, outcomes, and metric histories; compare campaigns and portfolio health; review marketing briefs and recommendations; and access the same approved records through the web app, HTTP API, or MCP server for AI assistants.
For brand demand, Brandwave reports 12 complete months of estimated branded-search demand and competitor Share of Search for a selected market. Optional first-party Google Search Console observations remain separate from estimates.
For customer and owned-property evidence, Brandwave supports GA4 success metrics selected from key events, regular events, or Google Tag Manager tags, with historical backfill and registered custom dimensions. HDYHAU reporting retains raw responses, reusable category mappings, response coverage, creator relevance, data-quality flags, and a daily timeline without assigning conversions. Direct-signal workflows discover promo-code and tagged-link evidence, support explicit mappings, and let teams ignore or restore noise.
For creator marketing, the record can also include cross-platform activity and performance from Instagram, YouTube, TikTok, X, LinkedIn, and Reddit alongside costs and outcomes.
Brandwave does not run survey panels, social-listening feeds, brand-lift experiments, marketing-mix models, or causal attribution. Use those specialist tools when needed. Brandwave connects activity, spending, outcomes, direct evidence, success metrics, and brand demand while keeping their differences clear.
Choose the specialist tools.
Compare survey trackers, experiment platforms, social listening, search evidence, and Brandwave by what each does best.
Define Share of Search properly
Set the terms, competitors, data source, baseline, confounders, and review rules before trusting the percentage.
Connect customer-reported evidence
Collect and structure what customers say introduced them without turning classification into causal attribution.
FAQ
Sources
- Google Trends: FAQ about Google Trends data (support.google.com)
- Google Ads Help: About Brand Lift (support.google.com)
- Pew Research Center: Writing survey questions (pewresearch.org)
- YouGov: BrandIndex (yougov.com)
- Tracksuit: How frequently does Tracksuit survey? (help.gotracksuit.com)
- Tracksuit: Why use a three-month rolling average? (help.gotracksuit.com)
- Attest: Brand tracking (askattest.com)
- Brandwatch: Consumer Research (brandwatch.com)
- Kantar Marketplace: Brand tracking (kantar.com)
- Google Analytics Help: About custom dimensions and metrics (support.google.com)
- Brandwave: HTTP API reference (gobrandwave.com)
Get the next article by email
Drop us your email and we'll let you know when we publish a new article.
By continuing you'll get an email for each new article and occasional product news from Brandwave. Unsubscribe any time. Privacy