On this page
- Calculate Share of Search with the definitions visible
- Share of Search is not Share of Voice or market share
- Build the brand term set before building the chart
- Fix the competitor set to the decision
- Choose a data source that matches the question
- Know when Share of Search is weak evidence
- Read absolute demand and relative share together
- Check confounders before assigning a cause
- Set a defensible baseline
- Run a monthly Share of Search review
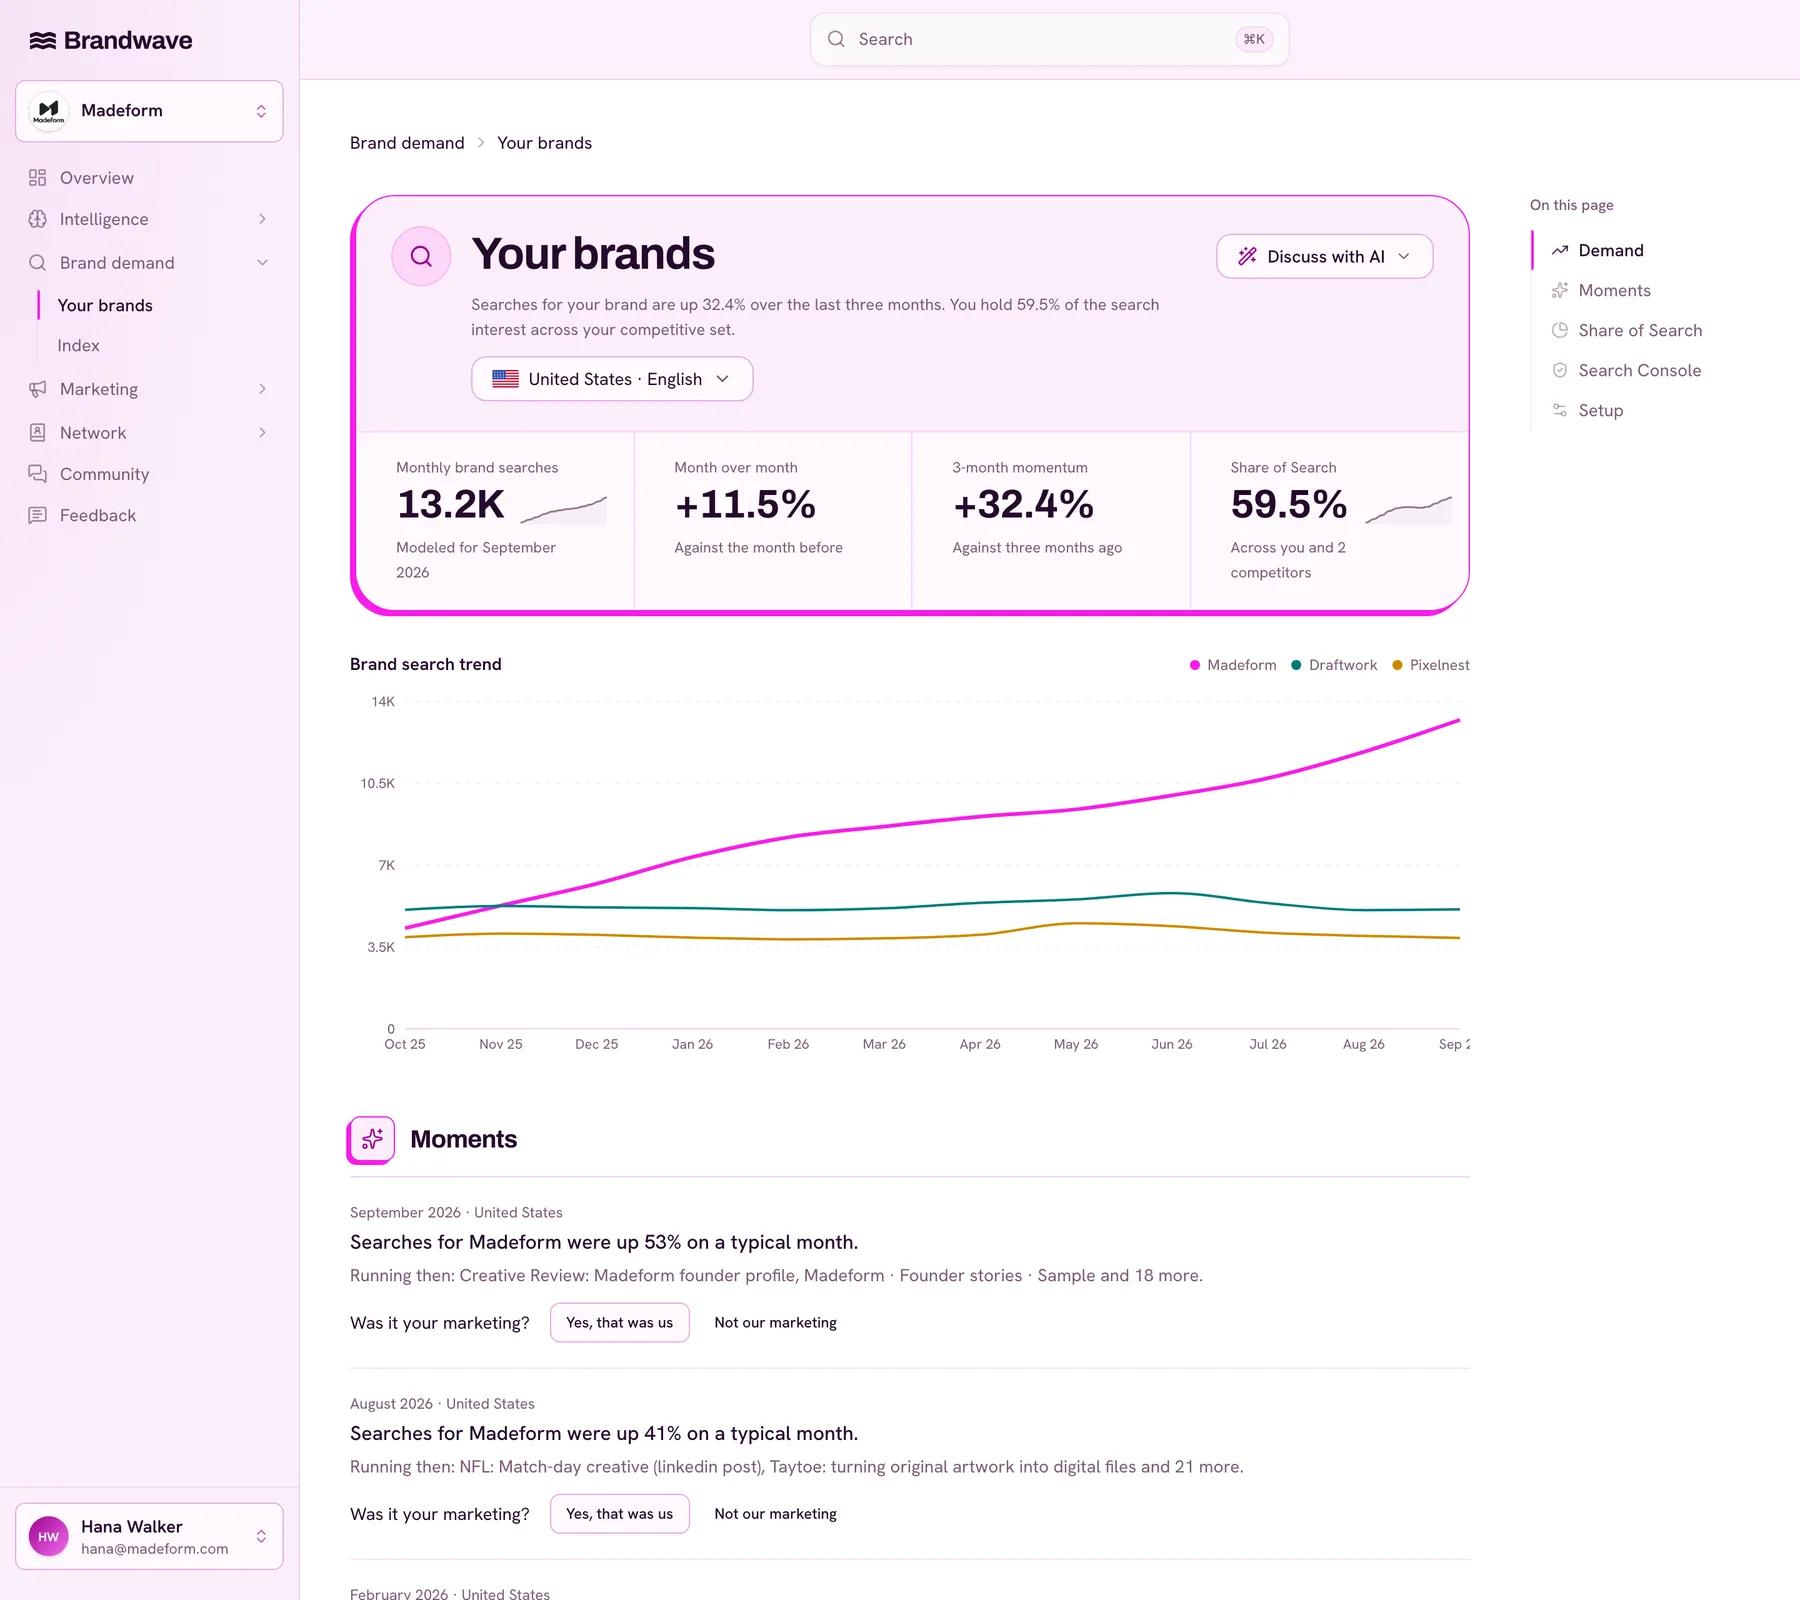
- Where Brandwave fits
- FAQ
Build the brand term set before building the chart
Choosing the right search terms is the most important step in the calculation. If your brand name is unique, you may only need one exact search term. If it is a common word, acronym, product family, renamed business, or part of a multi-brand company, list all relevant terms and any exclusions.
Start with the smallest set of terms you can justify. Only add a term if it clearly shows people are searching for your brand in the chosen market, and record when and why you added it. When a distinct branded term applies to the whole period, backfill its available history so every month uses the complete definition. Mark a dated break only when the brand identity or the market itself genuinely changed.
Common-word brand
- Decision to record
- Use topics, categories, or qualified phrases where the source permits
- Example risk
- Searches for the ordinary word inflate apparent brand demand
Acronym
- Decision to record
- Include only where market and context make the brand meaning credible
- Example risk
- The acronym belongs to other companies, qualifications, or concepts
Product brands
- Decision to record
- Decide whether the question concerns the parent, the portfolio, or one product
- Example risk
- One competitor is measured at company level and another at product level
Misspellings
- Decision to record
- Include stable, meaningful variants only
- Example risk
- A typo list creates noise or double-counts provider groupings
Rebrand or acquisition
- Decision to record
- Mark a series break or report old and new names separately during transition
- Example risk
- A renamed brand appears to collapse while the successor appears to surge
Support and login queries
- Decision to record
- Decide whether existing-customer demand belongs in the business question
- Example risk
- A large installed base looks like stronger future buyer demand
| Term issue | Decision to record | Example risk |
|---|---|---|
| Common-word brand | Use topics, categories, or qualified phrases where the source permits | Searches for the ordinary word inflate apparent brand demand |
| Acronym | Include only where market and context make the brand meaning credible | The acronym belongs to other companies, qualifications, or concepts |
| Product brands | Decide whether the question concerns the parent, the portfolio, or one product | One competitor is measured at company level and another at product level |
| Misspellings | Include stable, meaningful variants only | A typo list creates noise or double-counts provider groupings |
| Rebrand or acquisition | Mark a series break or report old and new names separately during transition | A renamed brand appears to collapse while the successor appears to surge |
| Support and login queries | Decide whether existing-customer demand belongs in the business question | A large installed base looks like stronger future buyer demand |
- Review each term in the target market, not only in your home market.
- Keep category queries out of a branded-search numerator.
- Use the same level of aggregation for your brand and every competitor.
- Keep a change log so a reviewer can see when the definition changed.
- Start a new comparison series when a change prevents a like-for-like history.
Fix the competitor set to the decision
You choose which brands to include in the comparison, not a tool. Pick the brands that real buyers would actually consider for the decision you are studying. The right set of competitors can change depending on whether you are looking at a broad category, a local sales list, or an investor's market definition.
Do not wait to add a fast-growing brand until it becomes a threat, and do not remove a declining competitor just to improve your numbers. If the competitive landscape changes, keep the old data, note the change, and start a new comparison.
Allocate next quarter's category budget
- Suitable set
- Brands competing for the same buyers in the same market
- Unsuitable set
- Every company that appears in a broad industry report
Track a regional launch
- Suitable set
- Available alternatives in that region
- Unsuitable set
- Global brands with no local distribution
Review one product line
- Suitable set
- Comparable product or sub-brand terms
- Unsuitable set
- A mixture of parent companies, products, and generic categories
Assess a rebrand
- Suitable set
- Old name, new name, and stable competitors with a marked transition
- Unsuitable set
- Replacing the old name silently in the historical calculation
| Decision | Suitable set | Unsuitable set |
|---|---|---|
| Allocate next quarter's category budget | Brands competing for the same buyers in the same market | Every company that appears in a broad industry report |
| Track a regional launch | Available alternatives in that region | Global brands with no local distribution |
| Review one product line | Comparable product or sub-brand terms | A mixture of parent companies, products, and generic categories |
| Assess a rebrand | Old name, new name, and stable competitors with a marked transition | Replacing the old name silently in the historical calculation |
Choose a data source that matches the question
There is no single source for Share of Search data. Google Trends, Google Search Console, third-party keyword tools, and other platforms each give a different view. Choose the source that fits your needs, whether you want a free index, data from your own site, estimates across competitors, or a regular managed report.
Google Trends
- What it provides
- Sampled, normalized, and scaled relative search interest
- Best use
- Free exploration across terms, topics, markets, and time
- Main limitation
- Not raw search volume; low-volume and ambiguous terms can be difficult to compare
Google Search Console
- What it provides
- Observed impressions, clicks, CTR, and position for queries where your property appeared
- Best use
- First-party validation of demand reaching your own site
- Main limitation
- No competitor demand, and query tables omit some anonymised or lower-volume rows
Third-party keyword estimates
- What it provides
- Modeled absolute search volumes across your brand and competitors
- Best use
- A comparable monthly market and competitor series
- Main limitation
- Provider methodology, grouping, update cadence, and model changes affect the estimates
SearchShare or Branquo
- What it provides
- Dedicated Share of Search reporting from a defined brand set
- Best use
- Teams that want a specialist workflow rather than a manual calculation
- Main limitation
- Verify the source data, term controls, market coverage, history, and definition changes
Glimpse
- What it provides
- Additional trend and estimated search-volume views around Google Trends
- Best use
- Teams already using Trends that want more context
- Main limitation
- Check how estimates and browser tooling affect reproducibility
Salyence
- What it provides
- Share of Search and AI-answer tracking
- Best use
- Teams comparing classic search visibility with assistant visibility
- Main limitation
- Search demand and AI recommendation presence are different metrics
Brandwave
- What it provides
- 12 complete months of modeled branded-search demand and competitor Share of Search for a selected market, with optional Search Console observations kept separate
- Best use
- Teams connecting brand demand to activity, costs, outcomes, customer evidence, and decisions
- Main limitation
- Not a survey panel, social-listening feed, brand-lift experiment, MMM, or causal attribution engine
| Source or tool | What it provides | Best use | Main limitation |
|---|---|---|---|
| Google Trends | Sampled, normalized, and scaled relative search interest | Free exploration across terms, topics, markets, and time | Not raw search volume; low-volume and ambiguous terms can be difficult to compare |
| Google Search Console | Observed impressions, clicks, CTR, and position for queries where your property appeared | First-party validation of demand reaching your own site | No competitor demand, and query tables omit some anonymised or lower-volume rows |
| Third-party keyword estimates | Modeled absolute search volumes across your brand and competitors | A comparable monthly market and competitor series | Provider methodology, grouping, update cadence, and model changes affect the estimates |
| SearchShare or Branquo | Dedicated Share of Search reporting from a defined brand set | Teams that want a specialist workflow rather than a manual calculation | Verify the source data, term controls, market coverage, history, and definition changes |
| Glimpse | Additional trend and estimated search-volume views around Google Trends | Teams already using Trends that want more context | Check how estimates and browser tooling affect reproducibility |
| Salyence | Share of Search and AI-answer tracking | Teams comparing classic search visibility with assistant visibility | Search demand and AI recommendation presence are different metrics |
| Brandwave | 12 complete months of modeled branded-search demand and competitor Share of Search for a selected market, with optional Search Console observations kept separate | Teams connecting brand demand to activity, costs, outcomes, customer evidence, and decisions | Not a survey panel, social-listening feed, brand-lift experiment, MMM, or causal attribution engine |
Do not combine Google Trends data, Search Console impressions, and estimated search volumes from other providers. Instead, compare the trends and explain any differences, making sure to keep the units and sources clear for each data set.
The brand tracking tools guide compares search evidence with survey panels, social listening, and brand-lift experiments when the decision requires a different method.
Read absolute demand and relative share together
Relative metrics can rise even if the overall market is shrinking. For example, in a category with three brands, your brand's monthly searches drop from 1,000 to 900, but your competitors' searches fall even more, from 3,000 to 2,100. Your Share of Search goes up from 25% to 30%, even though fewer people searched for your brand.
The right conclusion is not that your brand's demand grew. Instead, your brand lost less demand than the others. This can still matter for budgets or competition, but it is a different insight.
Your brand demand
- Baseline month
- 1,000
- Current month
- 900
- Change
- -10%
Competitor demand
- Baseline month
- 3,000
- Current month
- 2,100
- Change
- -30%
Total comparison-set demand
- Baseline month
- 4,000
- Current month
- 3,000
- Change
- -25%
Your Share of Search
- Baseline month
- 25%
- Current month
- 30%
- Change
- +5 percentage points
| Measure | Baseline month | Current month | Change |
|---|---|---|---|
| Your brand demand | 1,000 | 900 | -10% |
| Competitor demand | 3,000 | 2,100 | -30% |
| Total comparison-set demand | 4,000 | 3,000 | -25% |
| Your Share of Search | 25% | 30% | +5 percentage points |
- If absolute demand and share both rise, investigate whether brand demand is strengthening.
- If demand rises but share falls, the category or competitors are growing faster.
- If demand falls but share rises, the brand is declining more slowly than its competitors.
- If both fall, investigate category, product, distribution, reputation, and measurement changes before acting.
Check confounders before assigning a cause
Campaign activity
- Did paid, earned, creator, event, or partnership activity change during the period?
Publicity
- Was the brand in the news for reasons unrelated to buyer demand?
Seasonality
- Is the movement normal for this month, event, weather pattern, or buying cycle?
Product and price
- Did a launch, discontinuation, promotion, price change, or stock issue alter searches?
Distribution
- Did availability, territory, retail placement, or sales coverage change?
Competitors
- Did a competitor launch, rebrand, exit, fail, or receive unusual publicity?
Measurement
- Did terms, categories, markets, sources, or provider methodology change?
| Confounder | Question for the review |
|---|---|
| Campaign activity | Did paid, earned, creator, event, or partnership activity change during the period? |
| Publicity | Was the brand in the news for reasons unrelated to buyer demand? |
| Seasonality | Is the movement normal for this month, event, weather pattern, or buying cycle? |
| Product and price | Did a launch, discontinuation, promotion, price change, or stock issue alter searches? |
| Distribution | Did availability, territory, retail placement, or sales coverage change? |
| Competitors | Did a competitor launch, rebrand, exit, fail, or receive unusual publicity? |
| Measurement | Did terms, categories, markets, sources, or provider methodology change? |
A chart might show that Share of Search changed after a campaign, but it cannot prove the campaign caused the change. If you need to know what caused the change, run experiments. Also use campaign records, customer feedback, surveys, sales notes, Search Console data, business results, and outside events to help interpret the results.
Write down the best explanation that the evidence supports, along with any other possible reasons. This is more helpful than always trying to link every change to a campaign's success or failure.
Set a defensible baseline
- Name the business decision, owner, market, language, and review cadence.
- Define the brand terms and exclusions for every entity.
- Choose the competitor set from the buyer decision, not from the chart you want.
- Select one source for the comparable estimate series and record its methodology.
- Backfill enough history to see seasonality and known changes.
- Mark rebrands, launches, acquisitions, distribution changes, and competitor exits.
- Keep absolute search demand next to Share of Search.
- Compare the history with available sales, pipeline, survey, and customer evidence.
- Set a review threshold based on normal variation, not one surprising month.
- Record every definition change and begin a new series where comparability breaks.
A small team can manage this in a spreadsheet if everyone is clear on definitions, responsibilities, and review routines. The workbook below adds a Share of Search definition sheet to the brand-measurement source matrix, making changes to terms and competitors easy to see during monthly reviews.
Brand measurement source matrix
Use the Share of Search definitions sheet to keep track of markets, languages, brand terms, exclusions, competitor sets, sources, baseline periods, confounders, owners, and any changes to definitions. The workbook also includes the full source matrix and a monthly review section.
Where Brandwave fits
Brandwave provides 12 full months of modeled branded-search demand and competitor Share of Search for a chosen market. Your team sets the brand, exact terms, competitors, market, and language. Optional Google Search Console data such as impressions, clicks, CTR, and position are kept separate from the modeled data.
The full record links demand to campaigns, activities, creators, costs, results, GA4 success metrics, raw and normalized HDYHAU data, promo-code and tagged-link signals, comparisons, briefs, and recommendations. This approved record is available through the web app, HTTP API, and MCP server.
Brandwave does not conduct consumer surveys, gather social listening data from across the web, run brand-lift experiments, build marketing-mix models, or calculate cause and effect. Use a specialist method if your decision needs it. Use Brandwave to keep marketing work, evidence, and investment decisions connected.
Build the full brand measurement system
Put branded-search demand next to survey, customer, experimental, and commercial evidence without combining them into a single score.
Choose the right specialist method
Review survey trackers, brand-lift studies, social listening, search data, research tools, and marketing intelligence together to compare their strengths.
FAQ
Sources
- IPA: Share of Search (ipa.co.uk)
- IPA EffWorks: Share of Search as a Predictive Measure (ipa.co.uk)
- IPA: Cross-industry Share of Search think-tank findings (ipa.co.uk)
- Google Trends: FAQ about Google Trends data (support.google.com)
- Google Search Console: Performance report (support.google.com)
- Google Search Console: Performance dimensions and data groupings (support.google.com)
- Think with Google: Modern Brand Measurement playbook (thinkwithgoogle.com)
- Kantar: Demystifying Share of Search (kantar.com)
- Qualtrics: Understanding Share of Search (qualtrics.com)
- Share of Search Council: What is Share of Search? (myshareofsearch.com)
- Share of Search Council: Share of Search is not Google Trends (myshareofsearch.com)
- SearchShare: How it works (searchshare.io)
- Branquo: Share of Search reports (branquo.com)
- Glimpse: Share of Search guide (meetglimpse.com)
- Salyence: Share of Search and AI brand tracking (salyence.com)
- Brandwave: Brand demand HTTP API reference (gobrandwave.com)
Get the next article by email
Drop us your email and we'll let you know when we publish a new article.
By continuing you'll get an email for each new article and occasional product news from Brandwave. Unsubscribe any time. Privacy